Weekly Technical Analysis
Weekly Technical Analysis
Technical Analysis Weekly
Start your week by identifying the key price levels and trends.
The SpreadEx Research team has analysed the most popular markets, including stocks, indices, commodities & forex.
NOTE: These charts use the ‘Pro Trading Tools’ available on the SpreadEx trading platform. To use them, log in to your SpreadEx Financials Account and click ‘Technical’ from the menu on any chart.
WEEK COMMENCING 2nd march 2026
Summary
Instrument |
Trend |
Phase |
Price |
VWAP |
Support |
Resistance |
RSI |
|---|---|---|---|---|---|---|---|
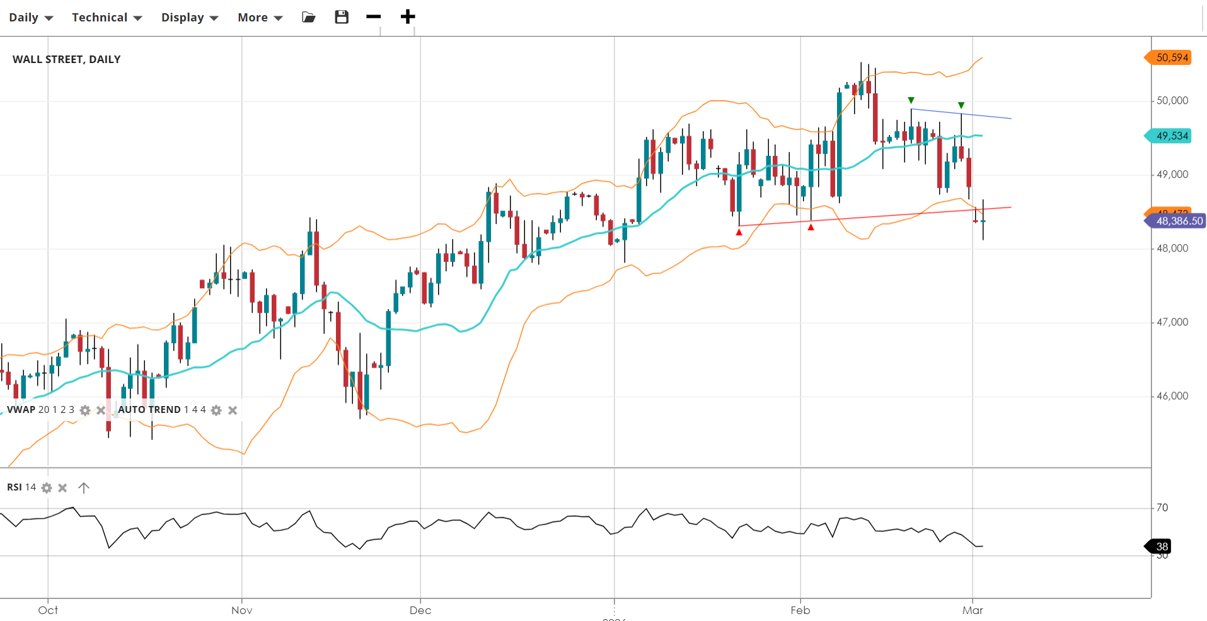
Wall Street |
Bullish |
Correction |
48,386 |
49,534 |
48,472 |
50,594 |
38 |
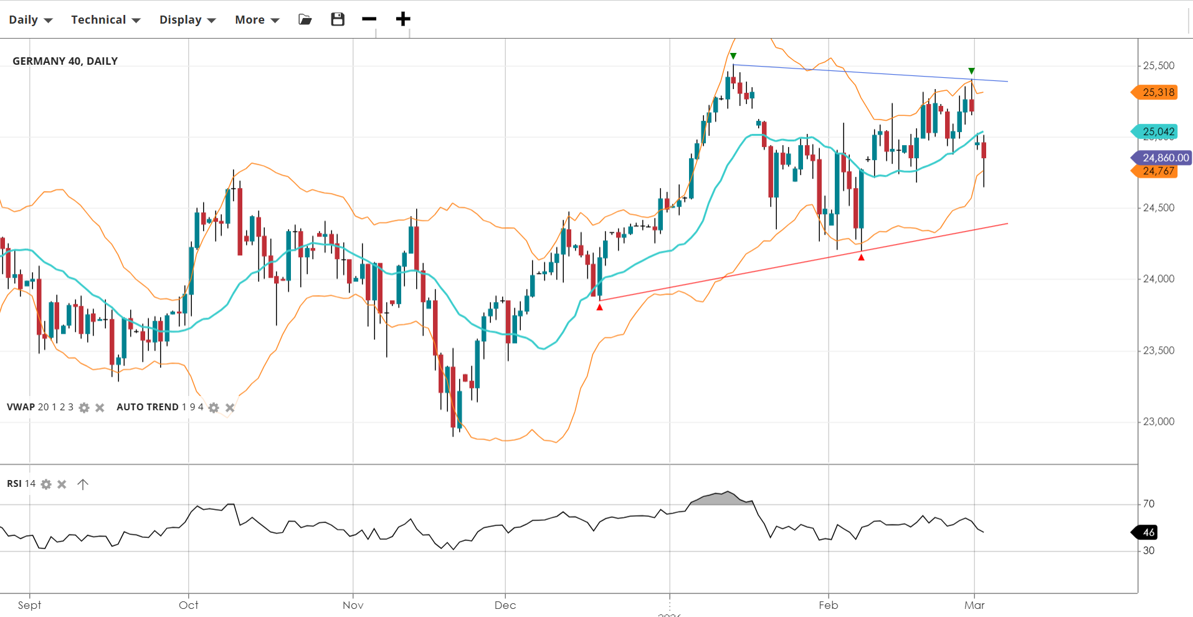
Germany 40 |
Sideways |
Range |
24,860 |
25,042 |
24,767 |
25,318 |
46 |
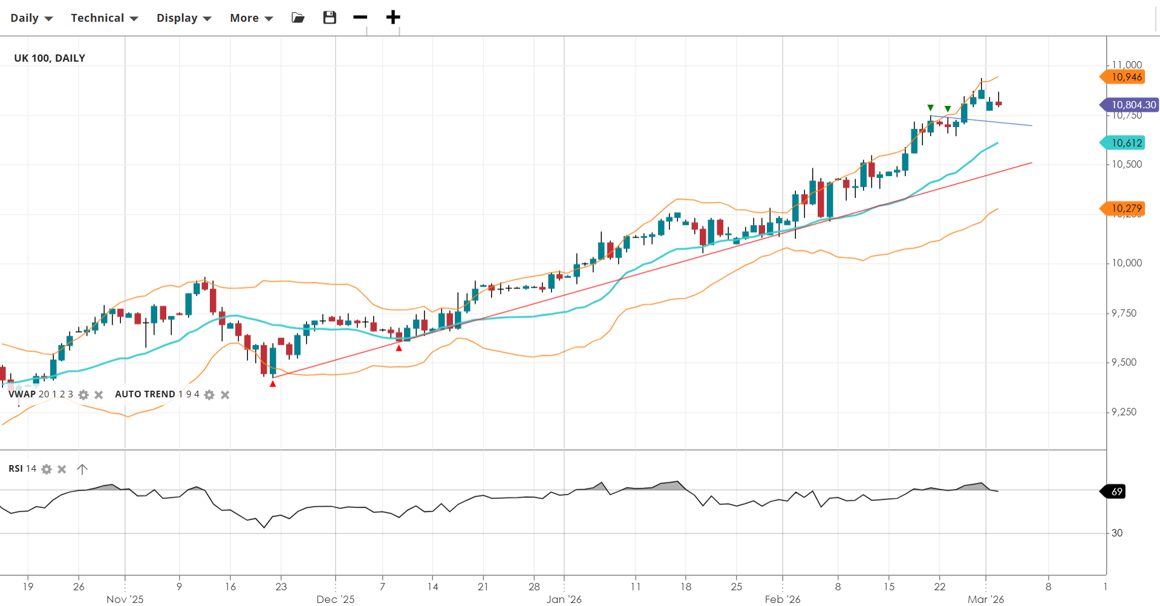
UK 100 |
Bullish |
Pullback |
10,804 |
10,612 |
10,279 |
10,946 |
69 |
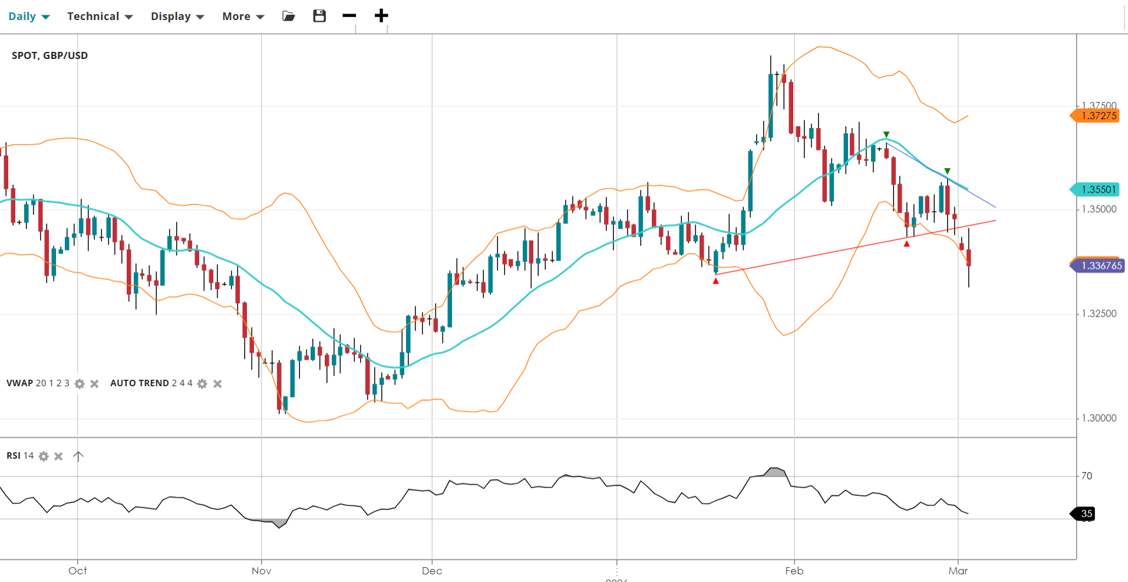
GBP/USD |
Bearish |
Impulsive |
1.3367 |
1.3550 |
1.3370 |
1.3725 |
35 |
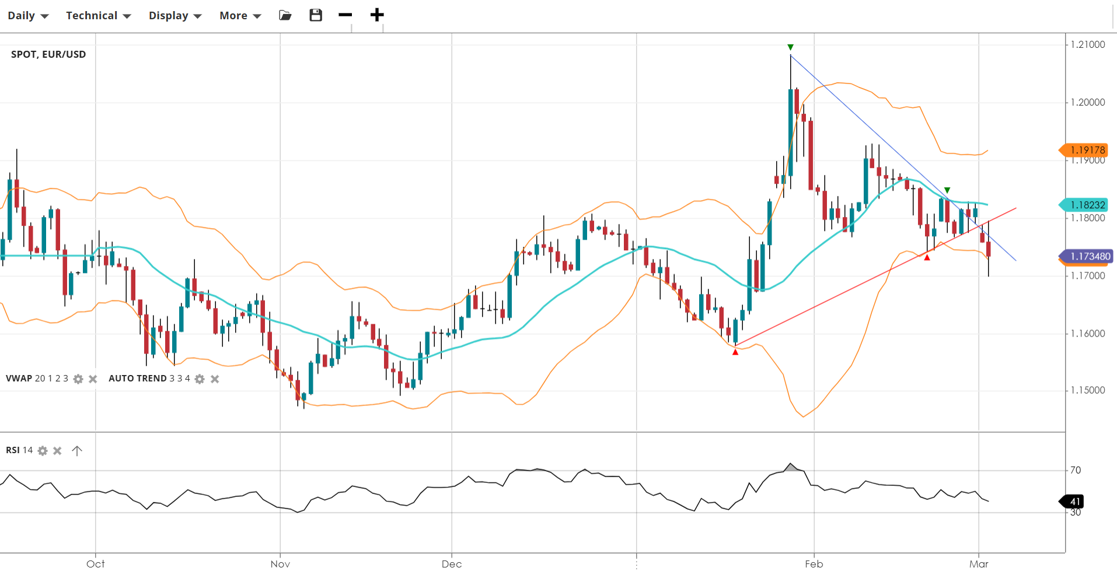
EUR/USD |
Sideways |
Range |
1.1734 |
1.1823 |
1.1730 |
1.1917 |
41 |
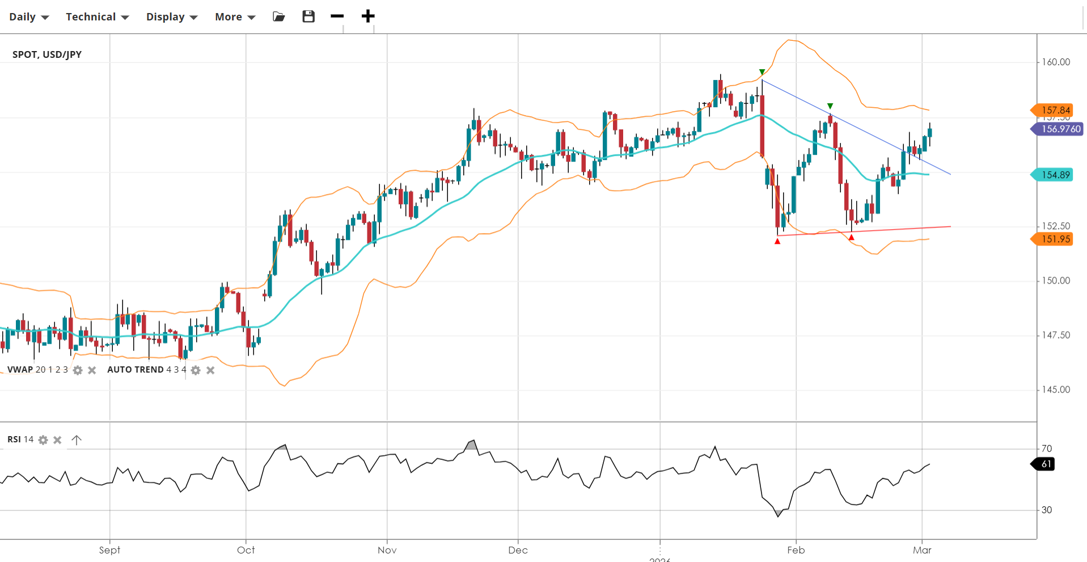
USD/JPY |
Sideways |
Range |
156.97 |
154.89 |
151.95 |
157.84 |
61 |
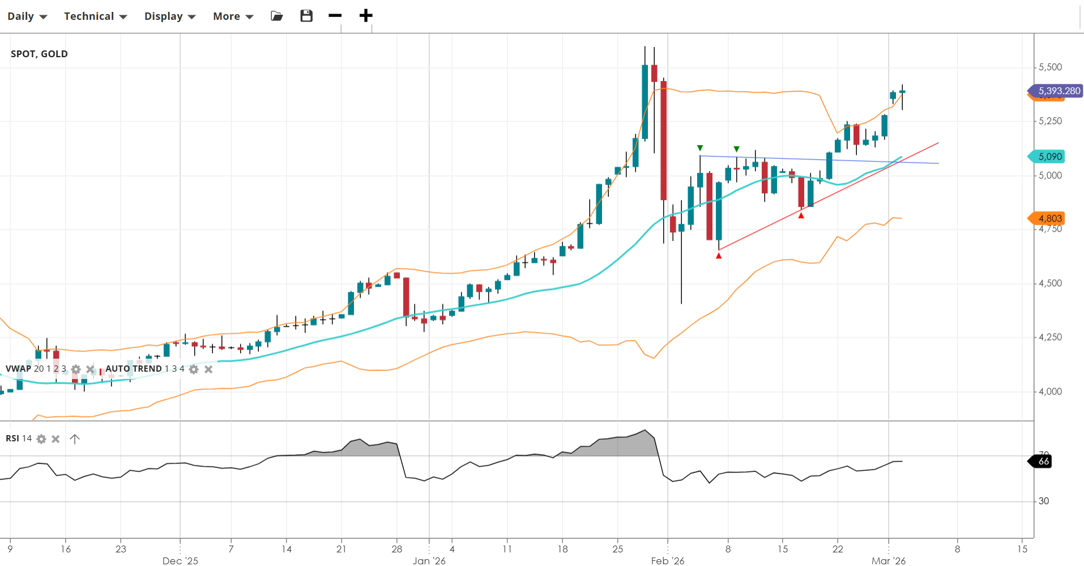
Gold |
Bullish |
Impulsive |
5,393 |
5,090 |
4,803 |
5,393 |
66 |
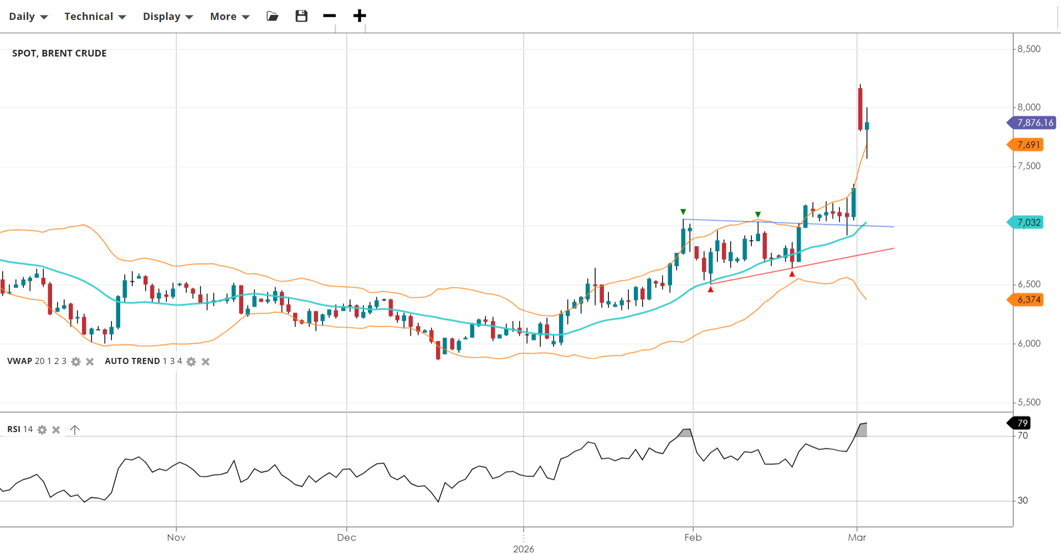
Brent Crude |
Bullish |
Impulsive |
7,876 |
7,032 |
6,374 |
7,691 |
79 |
*KEY*
- Price and 20-day VWAP at the time of writing.
- RSI level (70 is overbought and under 30 is oversold).
- Support & Resistance are set by the StdDev #2 Lower and Upper respectively.
- Trend is set by the slope of the VWAP over 50 periods.
- Phase is determined by the current price relative to the VWAP (20) level.
Analysis
Wall Street has entered a correction phase, trading below its short-term VWAP despite the broader bullish trend. Momentum has cooled significantly, with indicators suggesting the index is searching for a floor near the lower boundary of its volatility bands.
Germany 40 is currently range-bound, oscillating within a sideways trend. Price action is trading slightly below the VWAP, reflecting neutral momentum as the index continues to consolidate between established support and resistance levels.
UK 100 remains in a strong bullish trend but has entered a pullback phase. While it maintains its position above the VWAP, momentum is reaching elevated levels, suggesting the index is testing the upper limits of its current impulsive move.
GBP/USD has shifted into a bearish trend, with price action moving impulsively to the downside. The pair is trading well below its VWAP, and momentum indicators suggest heavy selling pressure as it approaches significant support levels.
EUR/USD is currently stuck in a sideways range, trading below its 20-day VWAP. Momentum is relatively weak, with the pair showing signs of consolidation as it tests the lower half of its current trading channel.
USD/JPY is positioned in the upper portion of its current sideways range. While the broader trend is neutral, short-term momentum is positive, with the price holding above the VWAP and trending toward the upper resistance ceiling.
Gold is in a powerful impulsive phase, trading significantly above its VWAP and appears on course to test record highs. Bullish momentum is strong, pushing the price toward the top of its standard deviation bands as the metal continues its upward trajectory.
Brent Crude has seen an aggressive breakout and is trading in a highly impulsive bullish phase. While the trend is strongly upward, momentum indicators have entered overbought territory, suggesting the market is significantly stretched relative to its mean.
It's easy to open an account
- Fill in our simple online application form
- Fund your account
- Start trading the global markets instantly!
SEARCH FOR AN ARTICLE:
Enter a keyword and search for all relevant articlesMARKET ANALYSIS
RECENT POSTS
DISCLAIMER
Spread bets and CFDs are complex instruments and come with a high risk of losing money rapidly due to leverage. 61% of retail investors lose money when trading spread bets and CFDs with this provider. You should consider whether you understand how spread bets and CFDs work and whether you can afford to take the high risk of losing your money. For professional clients, spread betting and CFD trading can also result in losses larger than your initial stake or deposit.
Spreadex Ltd is authorised and regulated by the Financial Conduct Authority, provides an execution only service and does not provide advice in any way. Nothing within this update should be deemed to constitute the provision of investment advice, recommendations, any other professional advice in any way, or a record of our trading prices. This update does not constitute or form part of an offer of, or solicitation for a transaction in any financial instrument, nor shall it or the fact of its distribution form the basis of, or be relied on in connection with, any contract therefore. Any persons placing trades based on their interpretation of the comments or information within this update does so entirely at their own risk.
No representation, warranty, or undertaking, express or limited, is given as to the accuracy or completeness of the information or opinions contained within this update by Spreadex Ltd or any of its employees and no liability is accepted by such persons for the accuracy or completeness of any such information or opinions. As such, no reliance may be placed for any purpose on the information and opinions contained within this update.
The information contained within this update is the intellectual property of Spreadex Ltd and is protected by UK and International copyright laws. All rights reserved. Users may however freely download, distribute and reproduce extracts of the contents, subject always to accrediting Spreadex Ltd as the source and providing a hyperlink to www.spreadex.com.


