Weekly Technical Analysis
Weekly Technical Analysis
Technical Analysis Weekly
Start your week by identifying the key price levels and trends.
The SpreadEx Research team has analysed the most popular markets, including stocks, indices, commodities & forex.
NOTE: These charts use the ‘Pro Trading Tools’ available on the SpreadEx trading platform. To use them, log in to your SpreadEx Financials Account and click ‘Technical’ from the menu on any chart.
WEEK COMMENCING 13th APRIL 2026
Summary
| Instrument | Trend | Phase | Price | VWAP | Support | Resistance | RSI |
|---|---|---|---|---|---|---|---|
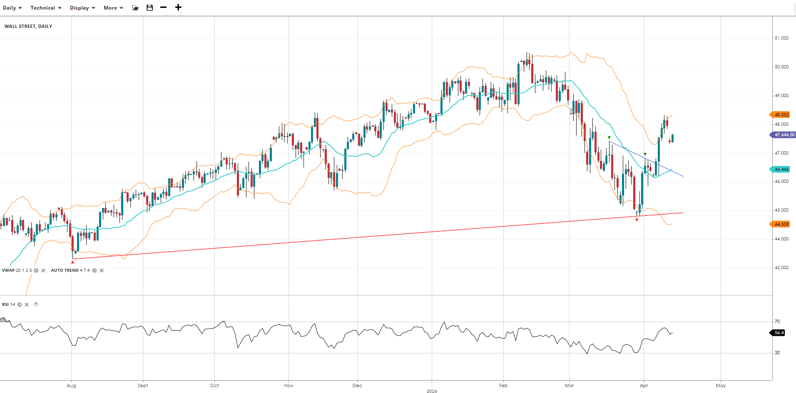
| Wall Street | Bearish | Correction | 47,647 | 46,446 | 44,539 | 48,352 | 56 |
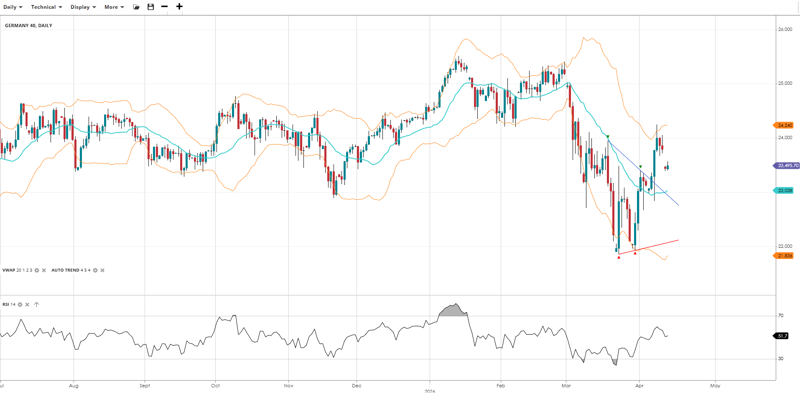
| Germany 40 | Bearish | Correction | 23,496 | 23,038 | 21,836 | 24,240 | 52 |
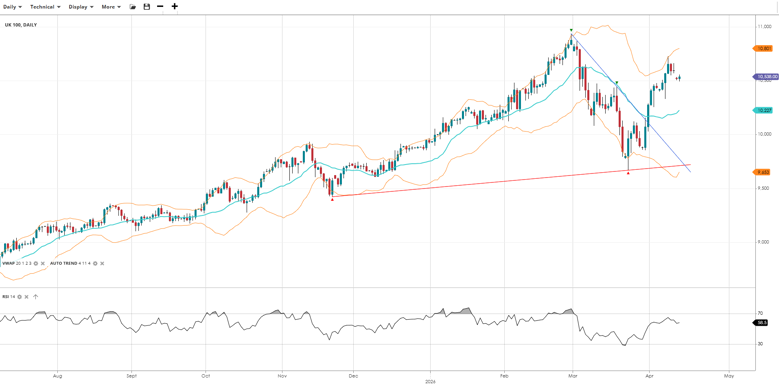
| UK 100 | Neutral | Range | 10,538 | 10,227 | 9,653 | 10,801 | 59 |
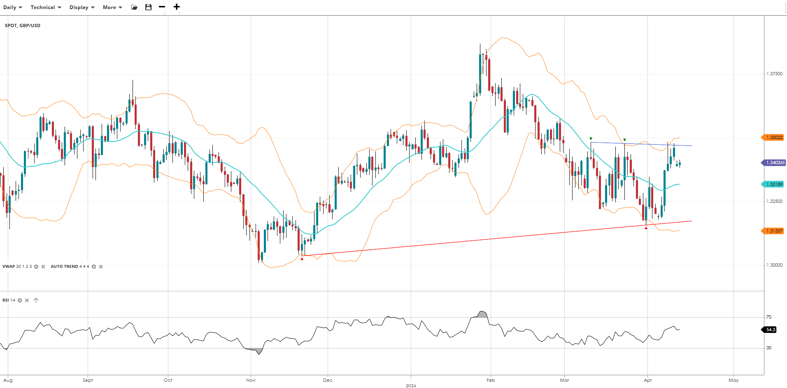
| GBP/USD | Neutral | Range | 1.3403 | 1.3319 | 1.3136 | 1.3502 | 54 |
| EUR/USD | Neutral | Range | 1.1681 | 1.1580 | 1.1429 | 1.1733 | 57 |
| USD/JPY | Bullish | Correction | 159.35 | 159.72 | 158.23 | 160.47 | 56 |
| Gold | Neutral | Range | 4,724 | 4,597 | 4,339 | 4,854 | 49 |
| Brent Crude | Neutral | Range | 9,835 | 10,208 | 9,094 | 11,322 | 50 |
*KEY*
- Price and 20-day VWAP at the time of writing.
- RSI level (70 is overbought and under 30 is oversold).
- Support & Resistance are set by the StdDev #2 Lower and Upper respectively.
- Trend is set by the slope of the VWAP over 50 periods.
- Phase is determined by the current price relative to the VWAP (20) level.
Analysis
Wall Street
Wall Street is in a bearish pullback phase, bouncing sharply off its lows and trading above the VWAP for the first time in weeks. Price has broken above the descending trendline that capped the selloff and is approaching upper resistance near 48,352. The RSI in the mid-50s reflects strengthening momentum.
Germany 40
The Germany 40 is in a bearish pullback phase, recovering strongly through the VWAP after breaking above the short-term descending trendline from the selloff. Price sits midway between the VWAP and upper resistance near 24,240, with the RSI near 52 suggesting the rebound has room to run. The broader downtrend from February highs remains intact until price clears that upper resistance zone.
UK 100
The strong rebound in the UK 100 places the overall price action in a trading range, with price trading above the VWAP and pushing toward upper resistance near 10,801. Price has broken above the descending trendline from the March highs, with the long-term ascending support trendline providing a floor below. The RSI near 59 reflects solid momentum.
GBP/USD
GBP/USD is rangebound near term and bigger picture, recovering sharply through the VWAP and sitting just below the descending trendline from the February highs. Price is pressing against upper resistance near 1.3502 with RSI at 54 supporting further upside. A convincing break above the upper band would challenge the broader bearish structure, while the long-term ascending support around 1.31 remains the key downside level.
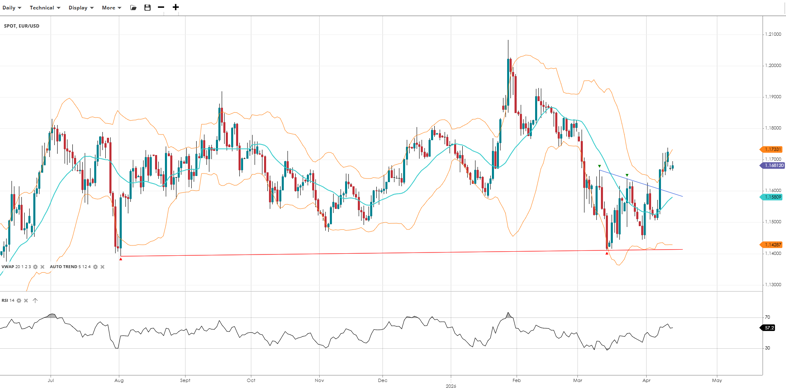
EUR/USD
EUR/USD has broken above a short term inverse H&S pattern which formed at the bottom of its long term range near 1.14. Price has rebounded strongly through the VWAP and is pressing toward upper resistance near 1.1733. The RSI at 57 reflects recovering bullish momentum. A sustained break above the upper band would shift the near-term bias decisively higher, while a break of 1.14 would open up a new long term downtrend.
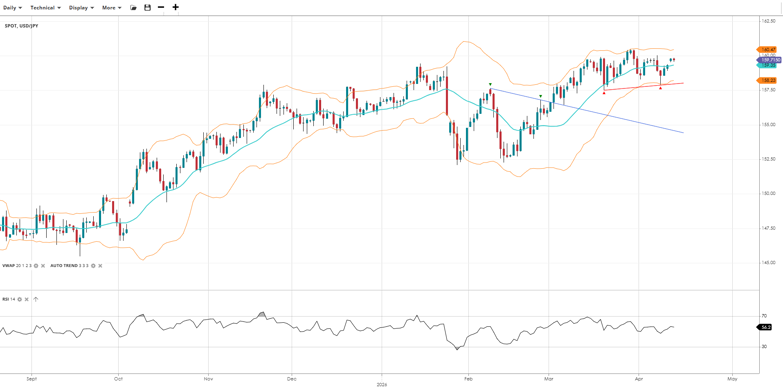
USD/JPY
USD/JPY is in a bullish correction phase, consolidating around the VWAP and key 160.0 figure within a narrowing range between ascending support and 160.5 resistance. The RSI at 56 is mildly bullish, consistent with a pause rather than a reversal. A solid breakout above 160 signals trend resumption; a failure to hold ascending support near 158.23 would concern bulls.
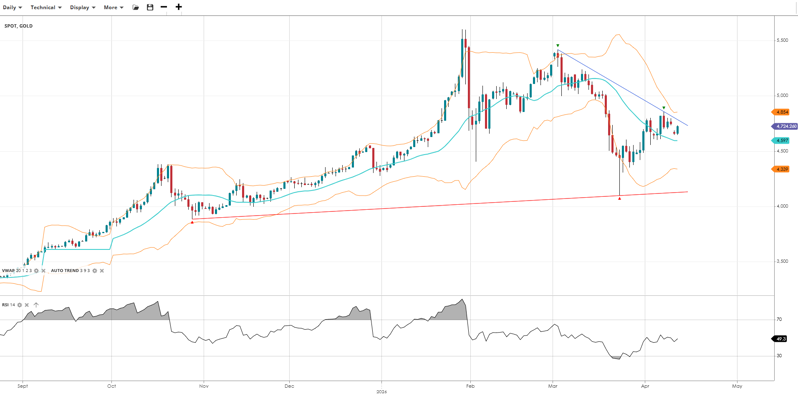
Gold
Near term, gold is in a bearish pullback phase but sits in a broader range between 4000 and 5500. Price sits mid-range between lower support near 4,339 and the descending trendline from the February peak acting as overhead resistance near 4,854. The RSI at 49 is neutral. The long-term ascending support trendline from late 2025 underpins the structure, and a break above the descending trendline would increase the chance of a return toward all-time highs.
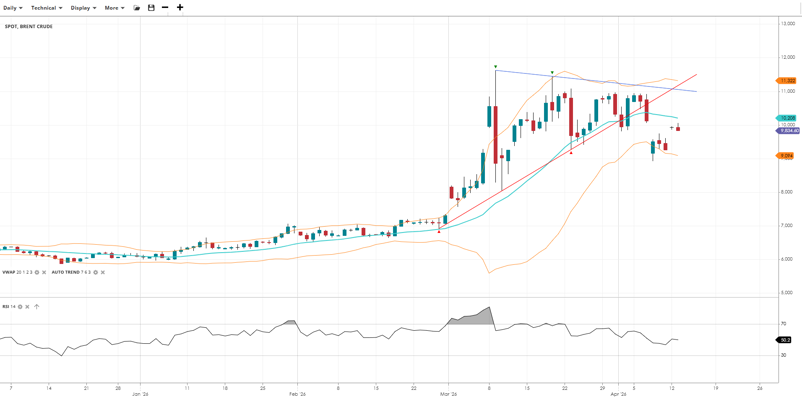
Brent Crude
Brent Crude has broken down from its triangle pattern but remains within a bullish correction phase, pulling back below the VWAP. Price sits near the middle of this structure at 9,835, with the RSI at 50 reflecting genuine indecision. The uptrend holds while price stays above ascending support, but a break lower would be a significant bearish signal; a break of the upper trendline targets 120 and beyond.
It's easy to open an account
- Fill in our simple online application form
- Fund your account
- Start trading the global markets instantly!
SEARCH FOR AN ARTICLE:
Enter a keyword and search for all relevant articlesMARKET ANALYSIS
RECENT POSTS
DISCLAIMER
Spread bets and CFDs are complex instruments and come with a high risk of losing money rapidly due to leverage. 61% of retail investors lose money when trading spread bets and CFDs with this provider. You should consider whether you understand how spread bets and CFDs work and whether you can afford to take the high risk of losing your money. For professional clients, spread betting and CFD trading can also result in losses larger than your initial stake or deposit.
Spreadex Ltd is authorised and regulated by the Financial Conduct Authority, provides an execution only service and does not provide advice in any way. Nothing within this update should be deemed to constitute the provision of investment advice, recommendations, any other professional advice in any way, or a record of our trading prices. This update does not constitute or form part of an offer of, or solicitation for a transaction in any financial instrument, nor shall it or the fact of its distribution form the basis of, or be relied on in connection with, any contract therefore. Any persons placing trades based on their interpretation of the comments or information within this update does so entirely at their own risk.
No representation, warranty, or undertaking, express or limited, is given as to the accuracy or completeness of the information or opinions contained within this update by Spreadex Ltd or any of its employees and no liability is accepted by such persons for the accuracy or completeness of any such information or opinions. As such, no reliance may be placed for any purpose on the information and opinions contained within this update.
The information contained within this update is the intellectual property of Spreadex Ltd and is protected by UK and International copyright laws. All rights reserved. Users may however freely download, distribute and reproduce extracts of the contents, subject always to accrediting Spreadex Ltd as the source and providing a hyperlink to www.spreadex.com.


