Weekly Technical Analysis
Weekly Technical Analysis
Technical Analysis Weekly
Start your week by identifying the key price levels and trends.
The SpreadEx Research team has analysed the most popular markets, including stocks, indices, commodities & forex.
NOTE: These charts use the ‘Pro Trading Tools’ available on the SpreadEx trading platform. To use them, log in to your SpreadEx Financials Account and click ‘Technical’ from the menu on any chart.
WEEK COMMENCING 23rd march 2026
Summary
Instrument |
Trend |
Phase |
Price |
VWAP |
Support |
Resistance |
RSI |
|---|---|---|---|---|---|---|---|
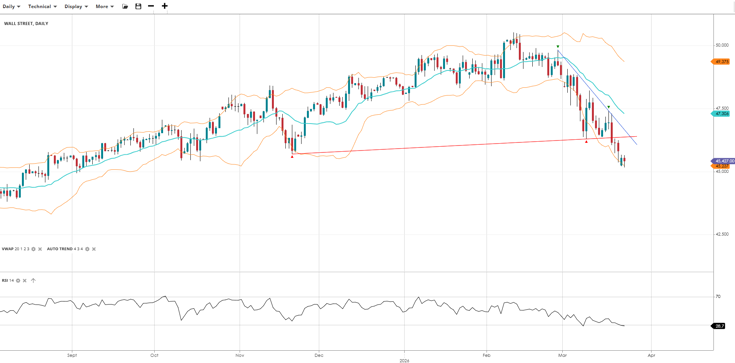
Wall Street |
Bearish |
Impulsive |
45,427 |
47,306 |
45,237 |
49,375 |
29 |
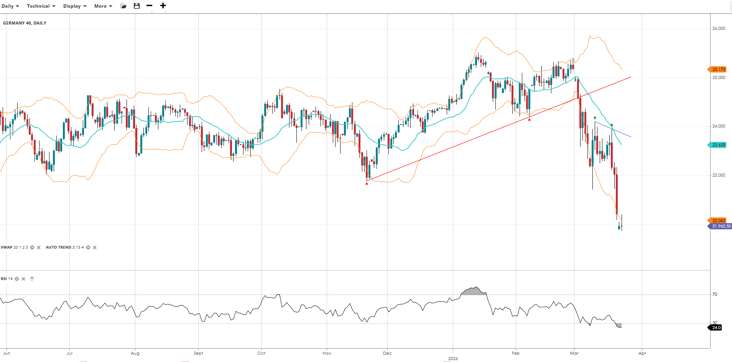
Germany 40 |
Bearish |
Impulsive |
21,963 |
23,628 |
22,083 |
25,173 |
24 |
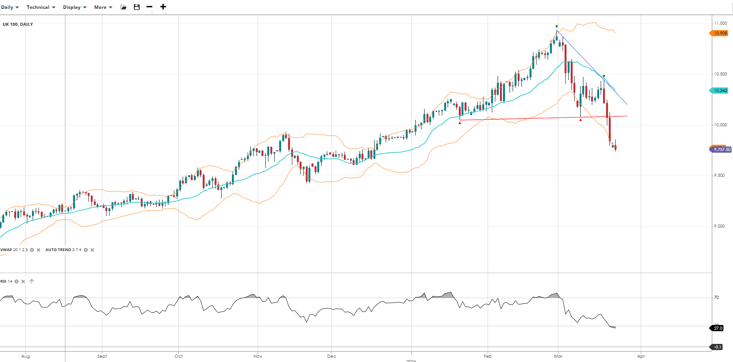
UK 100 |
Bearish |
Correction |
9,758 |
10,342 |
9,758 |
10,908 |
27 |
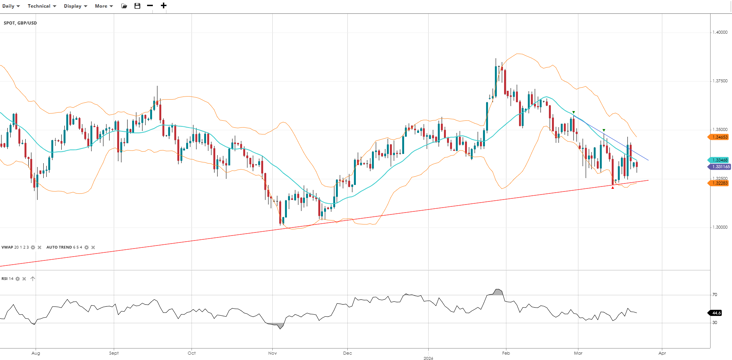
GBP/USD |
Neutral |
Range |
1.3312 |
1.3347 |
1.3228 |
1.3465 |
45 |
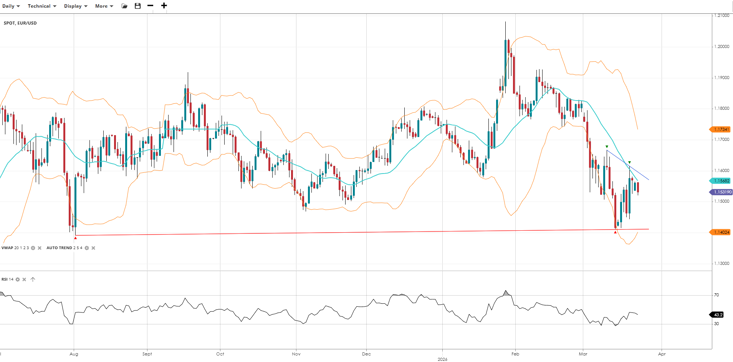
EUR/USD |
Neutral |
Range |
1.1532 |
1.1568 |
1.1402 |
1.1734 |
43 |
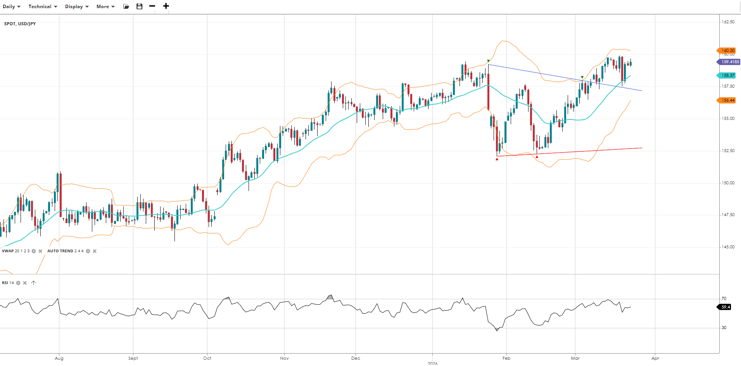
USD/JPY |
Bullish |
Pullback |
159.42 |
158.37 |
156.44 |
160.30 |
59 |
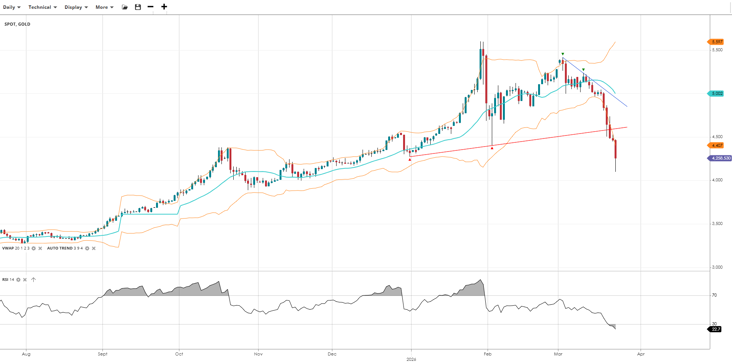
Gold |
Bearish |
Impulsive |
4,259 |
5,002 |
4,407 |
5,597 |
23 |
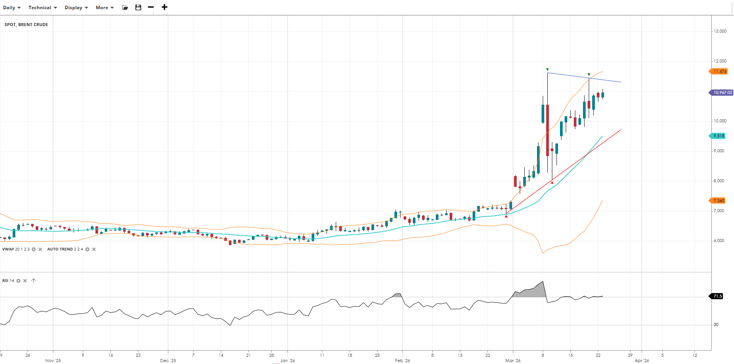
Brent Crude |
Bullish |
Impulsive |
10,967 |
9,518 |
7,360 |
11,676 |
72 |
*KEY*
- Price and 20-day VWAP at the time of writing.
- RSI level (70 is overbought and under 30 is oversold).
- Support & Resistance are set by the StdDev #2 Lower and Upper respectively.
- Trend is set by the slope of the VWAP over 50 periods.
- Phase is determined by the current price relative to the VWAP (20) level.
Analysis
Wall Street
Wall Street has broken down sharply, trading well below the VWAP and approaching key support. The RSI has collapsed near oversold territory, signalling intense selling pressure. The broader trend has turned bearish, and unless the index can reclaim the VWAP, further downside remains a real possibility.
Germany 40
The Germany 40 has suffered a severe breakdown, plunging through multiple support levels and now trading far below the VWAP. The RSI has crashed deep into oversold territory, reflecting the extraordinary pace of selling. The focus will be on whether buyers can step in to stabilise around the current lows before the index extends its losses.
UK 100
The UK 100 has reversed sharply from its all-time highs and is now deep in correction territory, trading well below the VWAP. The RSI has dropped toward oversold levels not seen in months, reflecting the severity of the sell-off. Prior support has flipped to resistance, and a recovery above the VWAP will be required to suggest any stabilisation.
GBP/USD
GBP/USD is trading just below its 20-day VWAP, while continuing to find a base above 1.3250 and a rising long term trendline. The RSI has come off bearish levels without getting oversold, leaving the long-term upwards bias intact. Bulls will need to defend the current support level to prevent a deeper retracement toward the 1.30 area.
EUR/USD
EUR/USD has rebounded decisively off 1.14 support but has found resistance at the VWAP as the near term bearish trend holds. The RSI confirms the easing of selling pressure but the pair has undercut multiple recent lows. The small down trendline has become the near-term resistance level bulls must reclaim to halt the decline.
USD/JPY
USD/JPY has pulled back after its breakout to the upside, trading above the VWAP in an impulsive phase as bullish momentum builds. The RSI has slipped from near overbought levels, signalling room to run before reaching overbought again. The pair is now testing resistance near the 160 level, a break above which would open the path to fresh highs.
Gold
Gold has suffered a dramatic sell-off, breaking below the psychologically significant 4,500 level as well as a long term rising trendline and falling well below the VWAP as bearish momentum intensifies. The RSI has collapsed deep into oversold territory, signalling the sharpest selling pressure seen in months. While a technical bounce is possible from these extreme levels, the trend is no longer up.
Brent Crude
Brent Crude is probing the highs reached in early March, trading well above the VWAP in a strong impulsive phase and. The RSI continues to hover in overbought territory, signalling the sharpest buying momentum seen in the current coverage universe. Likely outcomes appear quite binary, either a double top leading to much lower prices or a breakout - likely with significant upside momentum.
It's easy to open an account
- Fill in our simple online application form
- Fund your account
- Start trading the global markets instantly!
SEARCH FOR AN ARTICLE:
Enter a keyword and search for all relevant articlesMARKET ANALYSIS
RECENT POSTS
DISCLAIMER
Spread bets and CFDs are complex instruments and come with a high risk of losing money rapidly due to leverage. 61% of retail investors lose money when trading spread bets and CFDs with this provider. You should consider whether you understand how spread bets and CFDs work and whether you can afford to take the high risk of losing your money. For professional clients, spread betting and CFD trading can also result in losses larger than your initial stake or deposit.
Spreadex Ltd is authorised and regulated by the Financial Conduct Authority, provides an execution only service and does not provide advice in any way. Nothing within this update should be deemed to constitute the provision of investment advice, recommendations, any other professional advice in any way, or a record of our trading prices. This update does not constitute or form part of an offer of, or solicitation for a transaction in any financial instrument, nor shall it or the fact of its distribution form the basis of, or be relied on in connection with, any contract therefore. Any persons placing trades based on their interpretation of the comments or information within this update does so entirely at their own risk.
No representation, warranty, or undertaking, express or limited, is given as to the accuracy or completeness of the information or opinions contained within this update by Spreadex Ltd or any of its employees and no liability is accepted by such persons for the accuracy or completeness of any such information or opinions. As such, no reliance may be placed for any purpose on the information and opinions contained within this update.
The information contained within this update is the intellectual property of Spreadex Ltd and is protected by UK and International copyright laws. All rights reserved. Users may however freely download, distribute and reproduce extracts of the contents, subject always to accrediting Spreadex Ltd as the source and providing a hyperlink to www.spreadex.com.


