Financial Trading Blog
S&P 500 Defies September Slump Ahead of US NFP
Wall Street put in strong gains on Thursday with benchmark indices closing at the highest levels since mid-August, brushing aside September's reputation as the stock market's weakest month.
The S&P 500 climbed 1.06% to 7,747.94, its second straight day of gains as Treasury yields pulled back. The move comes hours before Friday's US non-farm payrolls report, the first major data point the Federal Reserve will weigh before its September 15-16 meeting.
Latest Market Moves
- The S&P 500 closed at 7,747.94 on Thursday, up 1.06%, and was last trading near 7,752 in early Friday dealing.
- The Dow Jones Industrial Average added 632 points, or 1.20%, to close at 53,699.
- The Nasdaq Composite rose 1.35% to 26,572, its strongest session of the week.
- The US 10-year Treasury yield fell 5 basis points to 4.75% after Fed Governor Christopher Waller signalled support for holding rates steady.
Rally Defies Historical September Weakness
September has a reputation problem.
Since 1928, it has delivered the weakest average return of any month, with the S&P 500 losing around 1.1% on average. This year's setup looks different.
August ended with the S&P 500 up 2.6%, its best August since 2021, leaving the index up 12.3% for the year and just 1.4% below its August 13 record of 7,798.99.
Worth noting: when August finishes positive and year-to-date gains sit between 10% and 17.5%, September has historically averaged a gain of around 1.0% rather than a loss. The index has also held above its 200-day moving average, a level that has separated stronger and weaker Septembers going back decades.
All Eyes on Today's NFP
Friday's jobs report is the next test.
Economists expect US employers added around 58,000 jobs in August, a rebound from July's surprise contraction of 23,000. The unemployment rate is forecast to hold at 4.1%, while annual wage growth is seen slowing to 3.1% from 3.2%.
The data lands two days after Waller said he would be inclined to keep rates on hold if inflation keeps cooperating, comments that helped pull yields lower and stocks higher on Thursday. A number close to consensus would likely reinforce that path, while a much weaker or stronger print could shift how the Fed's September 15-16 meeting plays out.
S&P 500: Breaking Free of the Channel
The chart shows the S&P 500 attempting to clear a three-week hurdle.
Since topping out at its August 13 record, the index had been sliding inside a descending channel on the 4-hour chart, testing the lower boundary near 7,620 in late August before turning back up. Thursday's rally pushed price back above the channel's upper trendline, with the index last near 7,752.
The zone between roughly 7,500 and 7,620 marks the range the index spent most of the second quarter consolidating in before breaking higher in early August, and it now underpins the broader advance as support.
The 14-period RSI has climbed to 69.5, just shy of the 70 level that typically flags overbought conditions. A clean break above the August high would put the index into uncharted territory, while a slide back under the channel's trendline would question whether Thursday's move can hold.
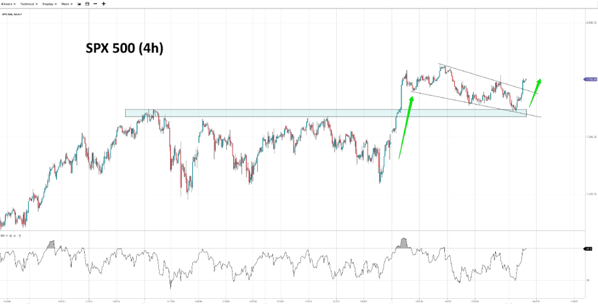
Source: SpreadEx | S&P 500, 4-Hour Chart
It's easy to open an account
- Fill in our simple online application form
- Fund your account
- Start trading the global markets instantly!
SEARCH FOR AN ARTICLE:
Enter a keyword and search for all relevant articlesMARKET ANALYSIS
RECENT POSTS
DISCLAIMER
Spread bets and CFDs are complex instruments and come with a high risk of losing money rapidly due to leverage. 61% of retail investors lose money when trading spread bets and CFDs with this provider. You should consider whether you understand how spread bets and CFDs work and whether you can afford to take the high risk of losing your money. For professional clients, spread betting and CFD trading can also result in losses larger than your initial stake or deposit.
Spreadex Ltd is authorised and regulated by the Financial Conduct Authority, provides an execution only service and does not provide advice in any way. Nothing within this update should be deemed to constitute the provision of investment advice, recommendations, any other professional advice in any way, or a record of our trading prices. This update does not constitute or form part of an offer of, or solicitation for a transaction in any financial instrument, nor shall it or the fact of its distribution form the basis of, or be relied on in connection with, any contract therefore. Any persons placing trades based on their interpretation of the comments or information within this update does so entirely at their own risk.
No representation, warranty, or undertaking, express or limited, is given as to the accuracy or completeness of the information or opinions contained within this update by Spreadex Ltd or any of its employees and no liability is accepted by such persons for the accuracy or completeness of any such information or opinions. As such, no reliance may be placed for any purpose on the information and opinions contained within this update.
The information contained within this update is the intellectual property of Spreadex Ltd and is protected by UK and International copyright laws. All rights reserved. Users may however freely download, distribute and reproduce extracts of the contents, subject always to accrediting Spreadex Ltd as the source and providing a hyperlink to www.spreadex.com.


