Financial Trading Blog
Gold Might Have Turned a Corner After Midterms
Gold has spent the past three months being written off as a safe haven, but the US midterm results may have handed it a reason to fight back.
The metal jumped more than 2% on Wednesday to reclaim $4,000 an ounce after Democrats won control of both the House and the Senate. A softer dollar and lower Treasury yields did the heavy lifting, and the chart suggests last week's slide to a one-year low may have been a false break.
Latest Market Moves
Gold had been trading around $4,030 an ounce in early Wednesday trade, up about 2.5% on the day, having risen as high as $4,038.58. That followed a Tuesday session in which it ranged between $3,895.57 and $3,971.36 before closing at $3,930.33.
Silver outperformed, rising around 4% to trade near $51.80 an ounce.
The US Dollar Index slipped around 0.5% to near 101.4, a four-week low.
Bonds rallied, with the US 10-year Treasury yield down around 4 basis points to roughly 4.93% heading into Wednesday's European session, and the US 2-year Treasury yield easing to about 4.60%.
USD/CHF fell around 0.6% to near 0.8160, as the Swiss franc extended its run as the market's preferred haven.
Midterms Hand Gold a Lifeline
Tuesday's vote has set up a divided government for the rest of President Trump's term.
Democrats won control of both chambers of Congress, flipping Republican-held seats in several states. Any new federal legislation now faces a presidential veto, which makes big deficit-funded spending packages much harder to get through.
For gold, the effect runs through the bond market. Less room for fiscal expansion eases pressure on Treasury supply, and yields fell across the curve as the results came in, dragging the dollar lower with them.
Risk assets took the result badly, with AI-linked stocks particularly sensitive. The Nikkei 225 fell as much as 4.8% before closing down 1.4%, while Nasdaq futures dropped more than 2% at one point before trimming their losses.
A Haven That Hasn't Acted Like One
The rally is a welcome change of character for a metal that has gone missing as markets wobbled.
Over the past month, the Nasdaq 100 has dropped around 8.7% on worries about AI spending and valuations, yet gold has fallen around 2.7% over the same stretch rather than catching a bid. Friday's drop below $4,000 took it to its lowest level in a year, even with stocks sliding and the eight-month US-Iran war still unresolved.
Gold is now down around a quarter since the US and Israel first struck Iran on 28 February, as surging energy prices pushed up interest-rate expectations. Treasuries haven't covered themselves in glory either, with the US 10-year Treasury yield still around 30 basis points higher than three months ago. The standout has been the Swiss franc, with EUR/CHF down around 1.6% over the past month to near 0.917.
Real Yields Are Still the Big Hurdle
The bigger problem for gold this autumn has been the price of money.
The Fed raised rates in September, and the 10-year TIPS yield, the market's main gauge of real yields, stood at 2.60% on Tuesday, around 0.8 percentage points higher than a year ago. A 10-year TIPS auction in September cleared at a real yield of 2.653%, the highest for that maturity since 2008.
Real yields have eased by around a third of a point over the past month, and Wednesday's drop in nominal yields should help again. But traders are still pricing in a better than 75% chance of another Fed hike in December, according to CME's FedWatch tool, which makes Friday's nonfarm payrolls report the next big test.
Central Banks Keep a Floor Under Prices
Beneath the price action, official demand has quietly picked up.
Central banks added a net 321 tonnes of gold to their reserves in the third quarter, the World Gold Council said on Tuesday, up 42% on a year earlier and the most since the final quarter of 2024. Poland and China led the officially reported buying.
ETF investors were still adding in the third quarter too, with inflows of 211 tonnes lifting global holdings to a record 4,256 tonnes. The weak spot was consumers, with jewellery demand down 17% to its weakest third quarter in WGC data going back to 2000.
Gold Technical View: False Break Puts the Downtrend Line in Play
The 8-hour chart shows why Wednesday's move could matter.
Gold broke below the $3,940-3,965 support zone that held in June and July, dropping to a one-year low of $3,870.32 on Friday. Sellers couldn't follow through, and the price was back inside the zone by Monday's close before Wednesday's jump above $4,000 marked the break as a false one.
The test now is the downtrend line from the early-September high near $4,510, which has capped every rally since and comes in around $4,050. The 14-period RSI is also pressing against resistance in the low 50s that has turned it back several times since September.
A push through both would be the clearest signal yet that the three-month downtrend has run its course, with the late-October high of $4,082.83 the next marker. Failure here would put the support zone, and Friday's $3,870 low beneath it, back in focus.
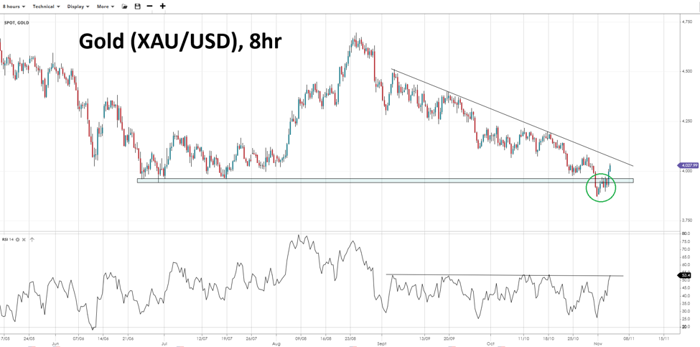
Source: SpreadEx | Gold (XAU/USD), 8hr Chart
It's easy to open an account
- Fill in our simple online application form
- Fund your account
- Start trading the global markets instantly!
SEARCH FOR AN ARTICLE:
Enter a keyword and search for all relevant articlesMARKET ANALYSIS
RECENT POSTS
DISCLAIMER
Spread bets and CFDs are complex instruments and come with a high risk of losing money rapidly due to leverage. 64% of retail investors lose money when trading spread bets and CFDs with this provider. You should consider whether you understand how spread bets and CFDs work and whether you can afford to take the high risk of losing your money. For professional clients, spread betting and CFD trading can also result in losses larger than your initial stake or deposit.
Spreadex Ltd is authorised and regulated by the Financial Conduct Authority, provides an execution only service and does not provide advice in any way. Nothing within this update should be deemed to constitute the provision of investment advice, recommendations, any other professional advice in any way, or a record of our trading prices. This update does not constitute or form part of an offer of, or solicitation for a transaction in any financial instrument, nor shall it or the fact of its distribution form the basis of, or be relied on in connection with, any contract therefore. Any persons placing trades based on their interpretation of the comments or information within this update does so entirely at their own risk.
No representation, warranty, or undertaking, express or limited, is given as to the accuracy or completeness of the information or opinions contained within this update by Spreadex Ltd or any of its employees and no liability is accepted by such persons for the accuracy or completeness of any such information or opinions. As such, no reliance may be placed for any purpose on the information and opinions contained within this update.
The information contained within this update is the intellectual property of Spreadex Ltd and is protected by UK and International copyright laws. All rights reserved. Users may however freely download, distribute and reproduce extracts of the contents, subject always to accrediting Spreadex Ltd as the source and providing a hyperlink to www.spreadex.com.


