Financial Trading Blog
Gold Breaks Lower After FOMC Minutes
Gold has sunk to a 14-month low after minutes from the Fed's October meeting showed policymakers lining up behind further rate hikes.
Spot gold fell as much as 3.4% on Wednesday to $3,720 and closed near the lows, down 3.2% at $3,725. Selling pushed it down to $3,693.50 in early Thursday trade, leaving the metal roughly a third below its late-January record of around $5,600.
Latest Market Moves
Gold had steadied around $3,730 by late morning UK trade on Thursday, roughly flat on the day after hitting its 14-month low.
Silver dropped 4.9% on Wednesday to close at about $45.04, its lowest since September 2025, and was hovering just above $45 on Thursday.
Copper slid more than 5% on Wednesday to its lowest settlement since early April, dragging the wider metals complex lower.
US Dollar Index touched a 19-month high of 103.91 on Wednesday before easing to around 103.70 in Thursday's session.
US 10-year Treasury yield has held around or above 5% since the October CPI report on 10 November, and was near 5.09% on Thursday.
Minutes Keep Rate Hikes on the Table
The October minutes confirmed that the Fed's next move is up, not down.
Almost all participants judged that further rate rises would likely be appropriate to ensure "a timely return of inflation to the 2% objective". The Fed held its target range at 3.75% to 4.00% in October after hiking in September, but the minutes described the decision as a close call. Governor Lisa Cook and Cleveland Fed President Beth Hammack both preferred an immediate quarter-point increase.
Many officials also stressed that pausing did not signal any weakening in the committee's commitment to its inflation goal. Markets are close to fully priced for a quarter-point hike at the 8-9 December meeting, and Governor Christopher Waller has said a half-point move may be needed if core inflation stays hot.
Hot Inflation Set the Stage
The minutes landed on top of an inflation print that had already strengthened the hawks' hand.
US consumer prices rose 0.4% in October against forecasts of 0.3%, with core prices up 0.3% on the month. There was no annual figure because of missing data from last year's government shutdown, but September's annual rate stood at 3.7%. That 0.3% core reading meets the threshold Waller set for considering a half-point hike.
Strong Dollar, High Yields and No Safe-Haven Bid
Gold has lost its usual tailwinds, and several have turned into headwinds.
A dollar at a 19-month high makes bullion more expensive for buyers outside the US, while 10-year yields above 5% raise the cost of holding a metal that pays no income. Rate hikes also push up real yields, which have historically been one of gold's biggest drags.
Even risk aversion has not helped. The S&P 500 fell for three straight sessions to Wednesday's close, losing 3.1% from Friday, yet gold fell alongside it rather than catching a safe-haven bid. That points to a continued unwind of speculative positions built during a bull run that took gold up more than 170% from early 2024 to its January peak.
AI Spending Still Propping Up Growth
What gold probably needs is a weaker economy, and so far the US is not obliging.
US GDP grew at an annualised 3.4% in the third quarter, the fastest pace in a year, and the Atlanta Fed's GDPNow model started the fourth quarter at 3.2%. Much of that strength has come from investment, including the AI data centre buildout, which the October minutes flagged as a risk to both inflation and financial stability.
That engine faces political headwinds, with leading House Democrats calling for a national moratorium on new AI data centres following their midterm gains. Any federal legislation is unlikely before the new Congress sits in January, though, so for now growth remains strong enough to keep the Fed focused on inflation.
What Would Turn Gold Around
A lasting recovery likely needs a shift towards stagflation: slowing growth, sticky prices and a Fed that turns more dovish.
That mix would pull down real yields and the dollar while reviving gold's appeal as a hedge against policy mistakes. The next tests are the 9 December Fed decision, where a quarter-point move rather than a half-point one could be read as less hawkish, and November CPI the following day. Until growth shows real cracks, rallies may struggle to gain traction.
Gold Technical Analysis
The weekly chart shows gold breaking down from a large head and shoulders top.
The left shoulder formed around $4,380 in October 2025, the head at the $5,602 record in late January, and the right shoulder at $4,697 in late August. The neckline runs through the lows between roughly $3,870 and $3,960 from last October, June to July, and October this year, and this week's drop has taken the price clearly below it.
The weekly RSI held above its mid-range support throughout the bull run before breaking down in March, and has since been stuck in a lower range, reading around 35. Initial support sits at the September 2025 lows between $3,580 and $3,630, then $3,437, while the broken neckline around $3,870 to $3,960 now acts as resistance.
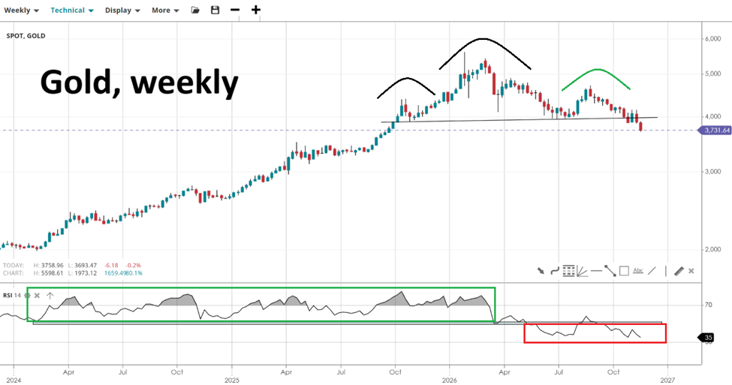
Source: SpreadEx | Gold, Weekly Chart
It's easy to open an account
- Fill in our simple online application form
- Fund your account
- Start trading the global markets instantly!
SEARCH FOR AN ARTICLE:
Enter a keyword and search for all relevant articlesMARKET ANALYSIS
RECENT POSTS
DISCLAIMER
Spread bets and CFDs are complex instruments and come with a high risk of losing money rapidly due to leverage. 64% of retail investors lose money when trading spread bets and CFDs with this provider. You should consider whether you understand how spread bets and CFDs work and whether you can afford to take the high risk of losing your money. For professional clients, spread betting and CFD trading can also result in losses larger than your initial stake or deposit.
Spreadex Ltd is authorised and regulated by the Financial Conduct Authority, provides an execution only service and does not provide advice in any way. Nothing within this update should be deemed to constitute the provision of investment advice, recommendations, any other professional advice in any way, or a record of our trading prices. This update does not constitute or form part of an offer of, or solicitation for a transaction in any financial instrument, nor shall it or the fact of its distribution form the basis of, or be relied on in connection with, any contract therefore. Any persons placing trades based on their interpretation of the comments or information within this update does so entirely at their own risk.
No representation, warranty, or undertaking, express or limited, is given as to the accuracy or completeness of the information or opinions contained within this update by Spreadex Ltd or any of its employees and no liability is accepted by such persons for the accuracy or completeness of any such information or opinions. As such, no reliance may be placed for any purpose on the information and opinions contained within this update.
The information contained within this update is the intellectual property of Spreadex Ltd and is protected by UK and International copyright laws. All rights reserved. Users may however freely download, distribute and reproduce extracts of the contents, subject always to accrediting Spreadex Ltd as the source and providing a hyperlink to www.spreadex.com.


