Financial Trading Blog
S&P 500 and Its Bad Breadth
The S&P 500 is within 1% of its record high, yet most of the stocks inside it are having a far rougher time.
By some measures, market breadth is the weakest it has been this close to a record since 2000. A handful of AI-driven tech giants with booming earnings are doing the heavy lifting, while the rest of the index, more exposed to the real economy and rising interest rates, is falling behind.
Latest Market Moves
S&P 500 futures were down about 0.4% early Monday, with the index trading around 7,700 after last week’s 1.2% gain, its best week since early August.
Nasdaq 100 futures slipped around 0.7% heading into Monday’s session, after the Nasdaq Composite jumped 2.1% last week as Meta surged about 13% on the launch of its new AI agent.
The S&P 500 Equal Weight index was down 4.9% from the 13 August record close as of Friday, against a dip of just 0.7% for the standard index, while S&P 600 small caps had fallen 7.5%.
The US 10-year Treasury yield ended last week around 5.18%, close to its highest level since 2007.
Brent crude climbed to around $106 a barrel in early Monday trade after President Trump rejected Iran’s ceasefire conditions, with WTI near $93.
Breadth at Its Worst Since 2000
Beneath the headline index, the numbers look far less healthy.
Only 27.4% of S&P 500 stocks were above their 50-day moving average at Friday’s close, a record low for an index this close to its peak. Fewer than half, 48.9%, were above their 200-day average, a reading last matched in April 2000 as the dot-com bubble began to burst.
According to Dow Jones Market Data, 59.2% of S&P 500 members were at least 20% below their all-time highs as of 21 September, putting them in bear market territory. That same day the index jumped 1.5%, yet 30 of its members hit new 52-week lows against just 7 new highs.
AI Earnings Do the Heavy Lifting
The split comes down to where the earnings growth is.
The Magnificent Seven now make up around a third of the S&P 500’s value, so a strong run from a few AI names can drag the whole index higher. FactSet data shows third-quarter earnings for information technology are expected to grow 63% year on year, with communication services at around 51%, well ahead of most other sectors.
Semiconductor stocks have gained about 4% since the S&P 500’s mid-August record, even as the typical stock has fallen. Last week showed the pattern clearly, with Meta’s AI launch helping the Nasdaq Composite rise 2.1% while the Dow Jones managed just 0.3%.
Higher Rates Squeeze the Rest
Outside big tech, the bigger story is the rising cost of money.
The Fed raised rates by 25 basis points to 3.75%-4% on 16 September, its first hike since 2023, and signalled one more before year-end. Chair Kevin Warsh said “the plain fact is that inflation is too high and has been for too long.”
With Brent above $100 on the Iran conflict and the 10-year yield near 19-year highs, smaller firms with floating-rate debt face higher borrowing costs just as consumers pull back, and University of Michigan sentiment fell to a four-month low of 48.1 on Friday. Cash-rich tech giants are far less exposed to that squeeze. This week’s PCE inflation data on Wednesday and Friday’s September jobs report will show whether that pressure is building or easing.
The Chart: Breakout Under Test
The 8-hour chart shows the S&P 500 retesting a fresh breakout.
The index spent late August and early September inside a falling channel, before breaking above it around 20 September and pushing back towards 7,800. It has since slipped back to test the top of that channel near 7,700, with the RSI cooling to a neutral 52.
Support sits at 7,600-7,650, where the June and July highs meet the 200-period moving average, and buyers stepped in quickly when the index briefly dipped below that zone in mid-September. A break above the record high near 7,817 would open the way to fresh highs, but a drop back below 7,600 would put the breakout in doubt and bring the September low near 7,500 into view.
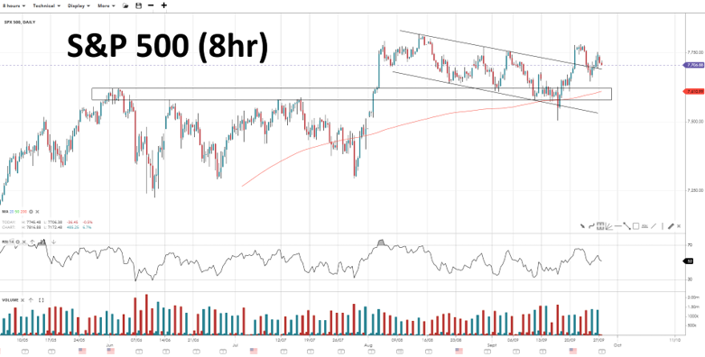
Source: SpreadEx | S&P 500, 8-Hour Chart
It's easy to open an account
- Fill in our simple online application form
- Fund your account
- Start trading the global markets instantly!
SEARCH FOR AN ARTICLE:
Enter a keyword and search for all relevant articlesMARKET ANALYSIS
RECENT POSTS
DISCLAIMER
Spread bets and CFDs are complex instruments and come with a high risk of losing money rapidly due to leverage. 61% of retail investors lose money when trading spread bets and CFDs with this provider. You should consider whether you understand how spread bets and CFDs work and whether you can afford to take the high risk of losing your money. For professional clients, spread betting and CFD trading can also result in losses larger than your initial stake or deposit.
Spreadex Ltd is authorised and regulated by the Financial Conduct Authority, provides an execution only service and does not provide advice in any way. Nothing within this update should be deemed to constitute the provision of investment advice, recommendations, any other professional advice in any way, or a record of our trading prices. This update does not constitute or form part of an offer of, or solicitation for a transaction in any financial instrument, nor shall it or the fact of its distribution form the basis of, or be relied on in connection with, any contract therefore. Any persons placing trades based on their interpretation of the comments or information within this update does so entirely at their own risk.
No representation, warranty, or undertaking, express or limited, is given as to the accuracy or completeness of the information or opinions contained within this update by Spreadex Ltd or any of its employees and no liability is accepted by such persons for the accuracy or completeness of any such information or opinions. As such, no reliance may be placed for any purpose on the information and opinions contained within this update.
The information contained within this update is the intellectual property of Spreadex Ltd and is protected by UK and International copyright laws. All rights reserved. Users may however freely download, distribute and reproduce extracts of the contents, subject always to accrediting Spreadex Ltd as the source and providing a hyperlink to www.spreadex.com.


