Weekly Technical Analysis
Weekly Technical Analysis
Technical Analysis Weekly
Start your week by identifying the key price levels and trends.
The SpreadEx Research team has analysed the most popular markets, including stocks, indices, commodities & forex.
NOTE: These charts use the ‘Pro Trading Tools’ available on the SpreadEx trading platform. To use them, log in to your SpreadEx Financials Account and click ‘Technical’ from the menu on any chart.
WEEK COMMENCING 1ST JUNE 2026
Summary
| Instrument | Trend | Phase | Price | VWAP | Support | Resistance | RSI |
|---|---|---|---|---|---|---|---|
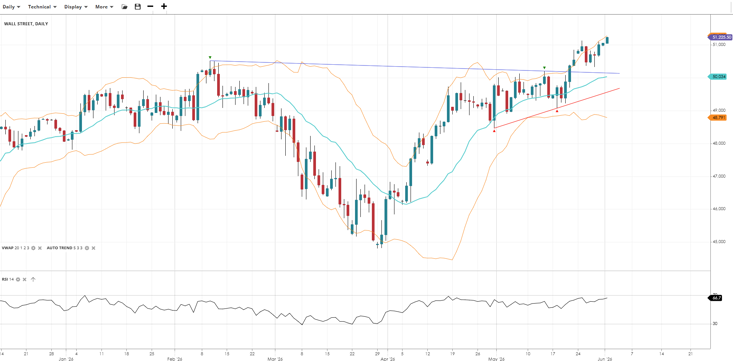
| Wall Street | Bullish | Breakout | 51,225 | 50,034 | 48,791 | 51,000 | 67 |
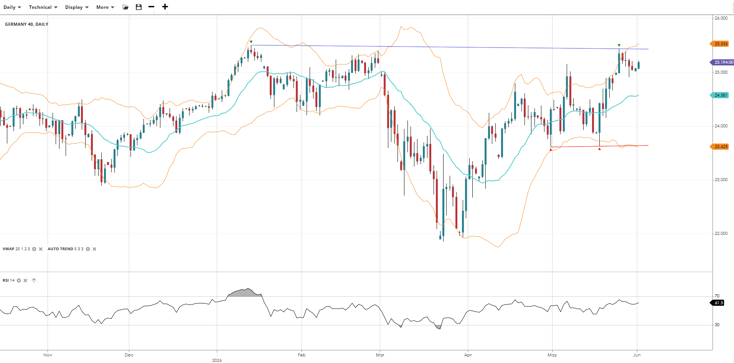
| Germany 40 | Bullish | Impulse | 25,194 | 24,581 | 23,625 | 25,536 | 62 |
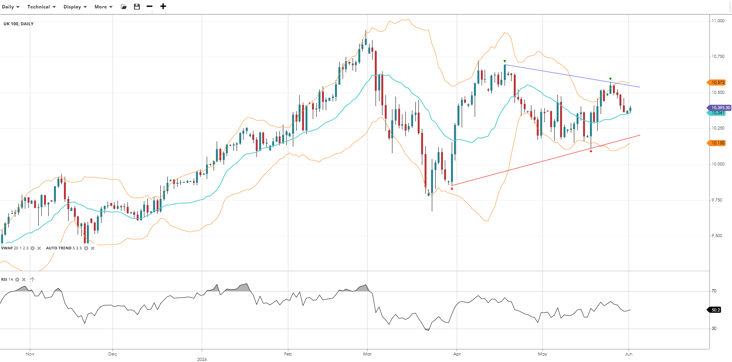
| UK 100 | Neutral | Range | 10,395 | 10,361 | 10,150 | 10,572 | 50 |
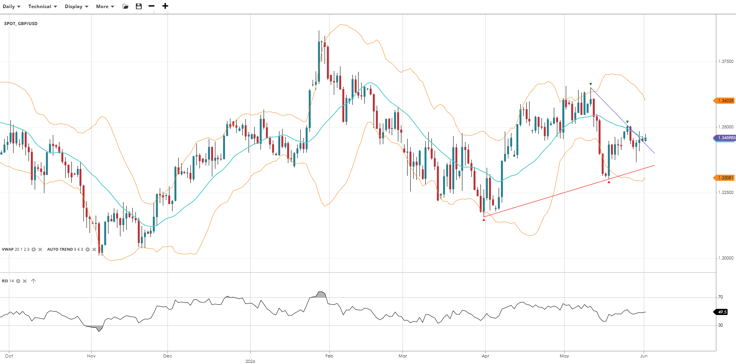
| GBP/USD | Neutral | Range | 1.3460 | 1.3308 | 1.3308 | 1.3602 | 50 |
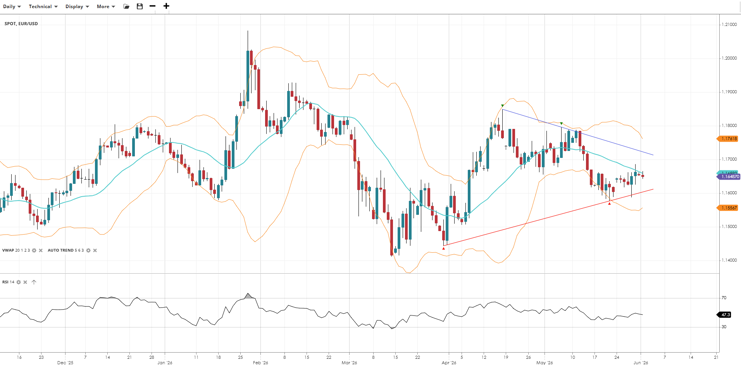
| EUR/USD | Neutral | Range | 1.1649 | 1.1649 | 1.1557 | 1.1762 | 47 |
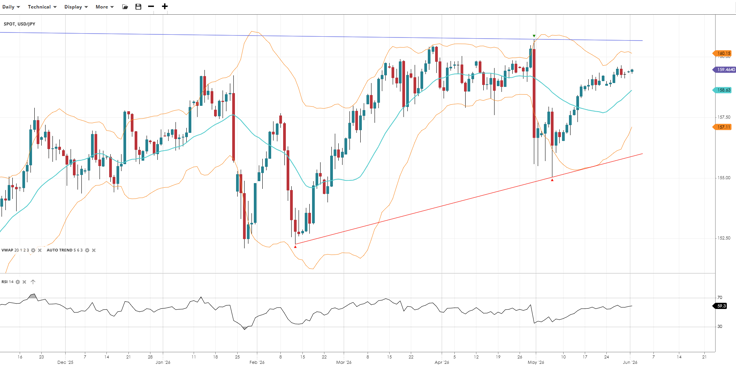
| USD/JPY | Neutral | Range | 159.46 | 158.63 | 157.11 | 160.15 | 59 |
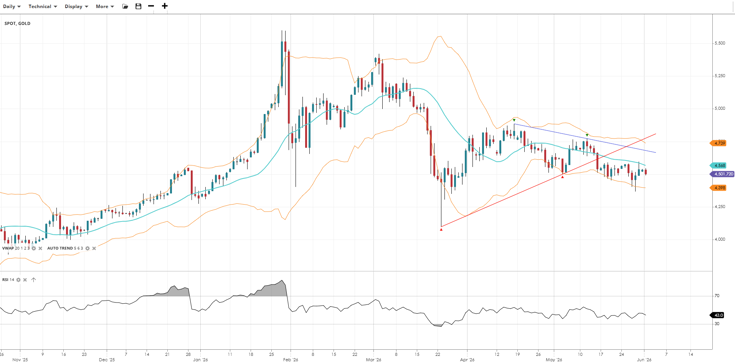
| Gold | Bearish | Correction | 4,502 | 4,568 | 4,398 | 4,759 | 43 |
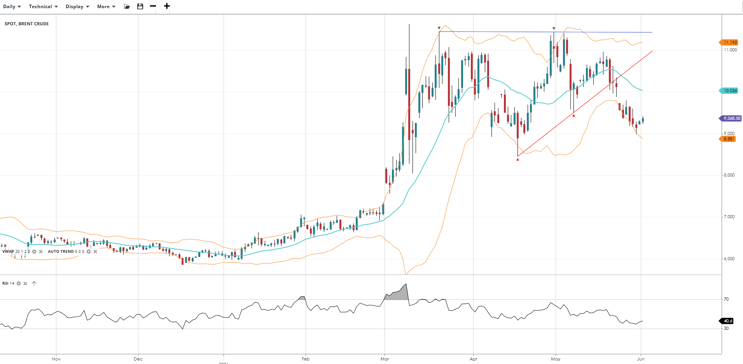
| Brent Crude | Neutral | Range | 9,368 | 10,036 | 8,881 | 11,192 | 41 |
*KEY*
- Price and 20-day VWAP at the time of writing.
- RSI level (70 is overbought and under 30 is oversold).
- Support & Resistance are set by the StdDev #2 Lower and Upper respectively.
- Trend is set by the slope of the VWAP over 50 periods.
- Phase is determined by the current price relative to the VWAP (20) level.
Analysis
Wall Street
Wall Street is pushing into new all-time high territory, extending the bullish breakout above the descending trendline that had capped the market since the February highs. Price is trading well above the VWAP and momentum remains firmly with the bulls. RSI is elevated but not yet overbought. The former resistance level is now the key support to hold on any pullback.
Germany 40
The Germany 40 has pulled back from flat/descending trendline resistance - setting up a possible breakout on the next attempt. Momentum remains strong and the index is comfortably above flat/rising support under 24K. A sustained close above that ceiling would open the door to fresh record highs.
UK 100
The UK 100 remains in a neutral sideways range, with price broadly in line with the VWAP and RSI at a neutral level. The descending upper trendline continues to cap upside while the ascending lower trendline limits the downside. A decisive break in either direction is needed to shift the bias.
GBP/USD
GBP/USD is in a neutral range, consolidating within a converging triangle as price and VWAP remain closely aligned. RSI is neutral, reflecting the lack of directional conviction. The narrowing range points toward a breakout resolution — another close above the descending trendline would be bullish, while a break of ascending support would reassert downside pressure.
EUR/USD
EUR/USD is in a neutral range, trading within a tightening triangle between the descending upper trendline and the ascending lower support. RSI carries a mild bearish tilt. The pair is at a decision point since a break above the descending trendline would be a significant bullish development, while a failure of ascending support would put the March lows back in focus.
USD/JPY
USD/JPY is in a neutral range but with a building bullish bias, trading above the VWAP and pressing toward the flat upper resistance. RSI reflects solid momentum. A sustained break above that resistance would confirm the next leg higher, while the ascending support trendline remains the key downside reference.
Gold
Gold remains in a gradual bearish correction, trading below the VWAP within a tight down sloping channel. RSI reflects continued corrective pressure. The broken ascending lower trendline adds a bearish bias. A recovery above the VWAP and descending trendline would be needed to restore a bullish bias.
Brent Crude
Brent Crude has deteriorated towards the bottom end of its months-long trading range, trading well below the VWAP after breaking under rising trendline support. RSI reflects sustained selling pressure. The April low is the key downside reference, while the VWAP then the flat upper resistance both represent significant overhead barriers to any recovery.
It's easy to open an account
- Fill in our simple online application form
- Fund your account
- Start trading the global markets instantly!
SEARCH FOR AN ARTICLE:
Enter a keyword and search for all relevant articlesMARKET ANALYSIS
RECENT POSTS
DISCLAIMER
Spread bets and CFDs are complex instruments and come with a high risk of losing money rapidly due to leverage. 61% of retail investors lose money when trading spread bets and CFDs with this provider. You should consider whether you understand how spread bets and CFDs work and whether you can afford to take the high risk of losing your money. For professional clients, spread betting and CFD trading can also result in losses larger than your initial stake or deposit.
Spreadex Ltd is authorised and regulated by the Financial Conduct Authority, provides an execution only service and does not provide advice in any way. Nothing within this update should be deemed to constitute the provision of investment advice, recommendations, any other professional advice in any way, or a record of our trading prices. This update does not constitute or form part of an offer of, or solicitation for a transaction in any financial instrument, nor shall it or the fact of its distribution form the basis of, or be relied on in connection with, any contract therefore. Any persons placing trades based on their interpretation of the comments or information within this update does so entirely at their own risk.
No representation, warranty, or undertaking, express or limited, is given as to the accuracy or completeness of the information or opinions contained within this update by Spreadex Ltd or any of its employees and no liability is accepted by such persons for the accuracy or completeness of any such information or opinions. As such, no reliance may be placed for any purpose on the information and opinions contained within this update.
The information contained within this update is the intellectual property of Spreadex Ltd and is protected by UK and International copyright laws. All rights reserved. Users may however freely download, distribute and reproduce extracts of the contents, subject always to accrediting Spreadex Ltd as the source and providing a hyperlink to www.spreadex.com.


