Weekly Technical Analysis
Weekly Technical Analysis
Technical Analysis Weekly
Start your week by identifying the key price levels and trends.
This week's technical overview covers eight key markets: Wall Street, Germany 40, UK 100, GBP/USD, EUR/USD, USD/JPY, Gold and Brent Crude, highlighting the prevailing trend, market phase, and the key support and resistance levels traders should have on their radar.
NOTE: These charts use the ‘Pro Trading Tools’ available on the SpreadEx trading platform. To use them, log in to your SpreadEx Financials Account and click ‘Technical’ from the menu on any chart.
WEEK COMMENCING 13TH JULY 2026
Summary
Instrument |
Trend |
Phase |
Price |
VWAP |
Support |
Resistance |
RSI |
|---|---|---|---|---|---|---|---|
Wall Street |
Bullish |
Pullback |
52,628 |
52,252 |
51,283 |
53,221 |
59 |
Germany 40 |
Bullish |
Correction |
25,084 |
24,950 |
24,331 |
25,833 |
50 |
UK 100 |
Bullish |
Correction |
10,472 |
10,520 |
10,332 |
10,708 |
48 |
GBP/USD |
Bearish |
Correction |
1.3386 |
1.3293 |
1.31233 |
1.3464 |
56 |
EUR/USD |
Bearish |
Correction |
1.1430 |
1.1414 |
1.13567 |
1.1470 |
46 |
USD/JPY |
Bullish |
Pullback |
162.10 |
161.83 |
161.01 |
162.64 |
58 |
Gold |
Bearish |
Correction |
4,067 |
4,050 |
3,974 |
4,213 |
41 |
Brent Crude |
Bearish |
Correction |
7,830 |
7,513 |
6,936 |
8,089 |
49 |
KEY
- Trend: The prevailing directional bias of the market — Bullish or Bearish.
- Phase: Whether price action is Impulsive (a strong, directional move) or Corrective (a retracement/consolidation against the prevailing trend).
- Price: The latest available spot price at time of writing.
- VWAP: Volume Weighted Average Price — a dynamic benchmark showing the average price paid, weighted by volume.
- Support: A key price level below the market where buying interest has historically emerged.
- Resistance: A key price level above the market where selling interest has historically emerged.
- RSI: Relative Strength Index — a momentum oscillator; readings above 70 suggest overbought conditions, below 30 suggest oversold conditions.
Analysis
Wall Street
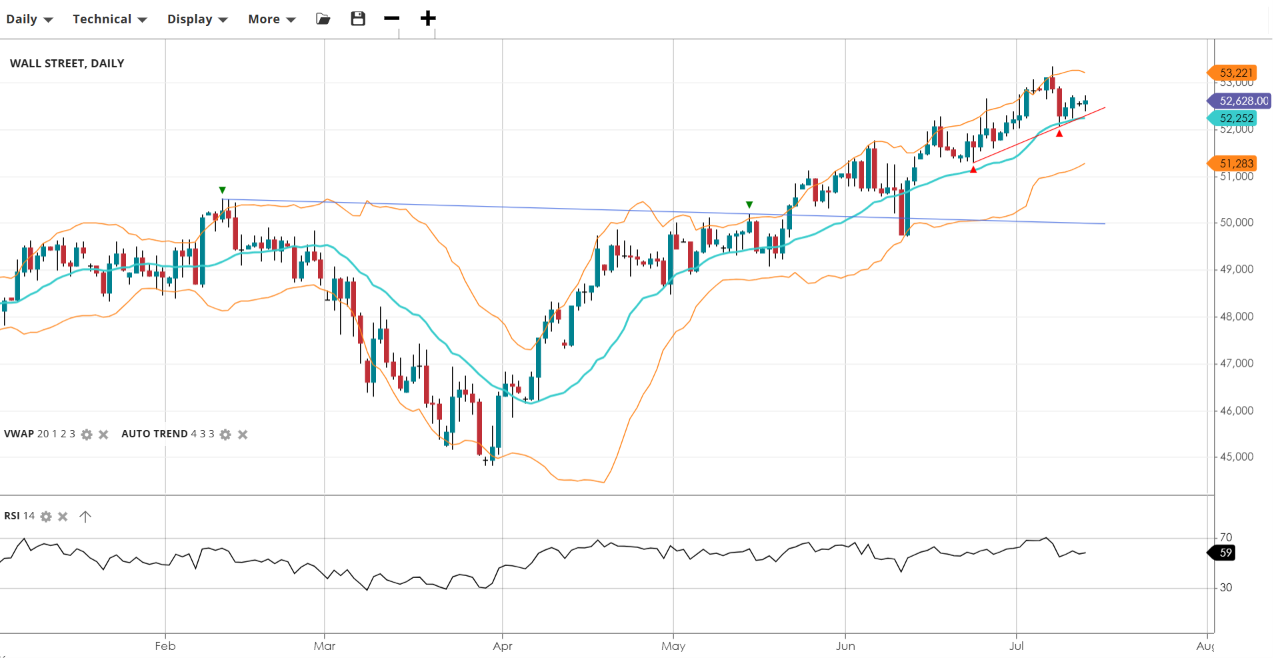
Wall Street has eased back from last week's highs, pulling through the rising trendline that had guided the advance since June and consolidating just above VWAP. The broader uptrend from the April low remains intact, with price still comfortably above the mid-band, but the cooling RSI reading points to a period of digestion rather than continued acceleration. A hold above VWAP would keep the path of least resistance to the upside.
Germany 40
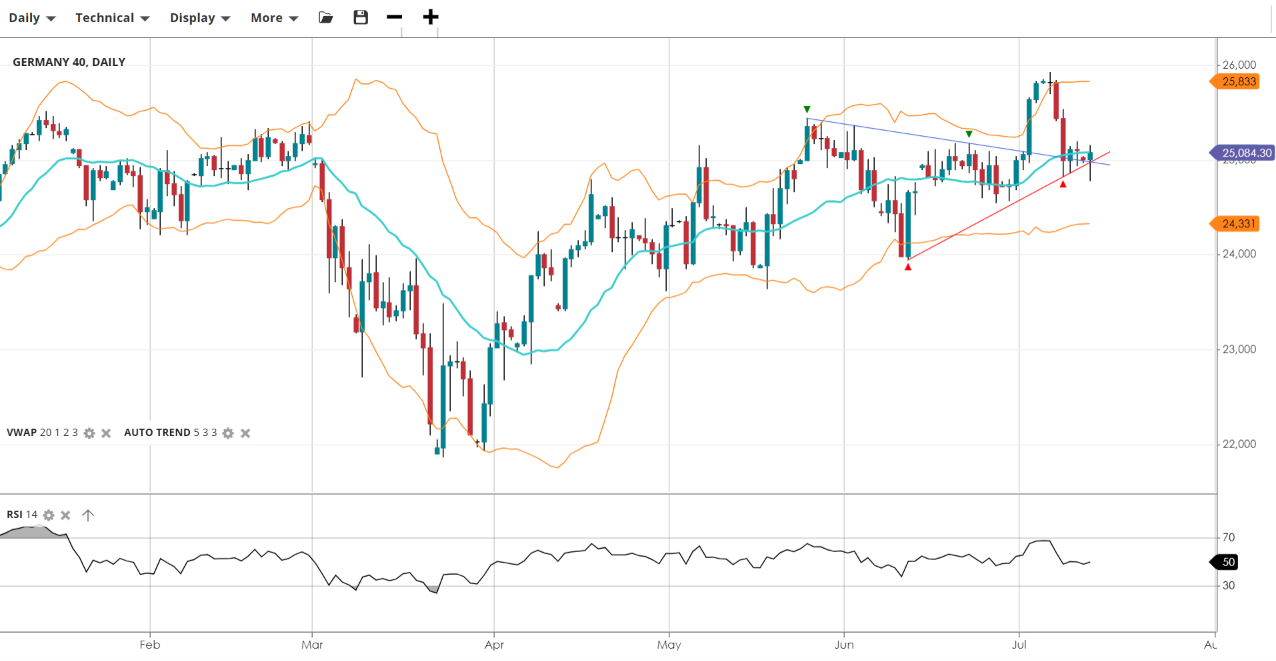
Germany 40 has pulled back sharply from last week's breakout high, giving back a large portion of the advance and now consolidating at the apex of a converging trendline pattern. Price is hovering close to VWAP, with the descending trendline from the July peak and the rising trendline from April now squeezing into a narrow range. A neutral RSI reading reflects the indecision, with a decisive break of either trendline likely to set the next directional move.
UK 100
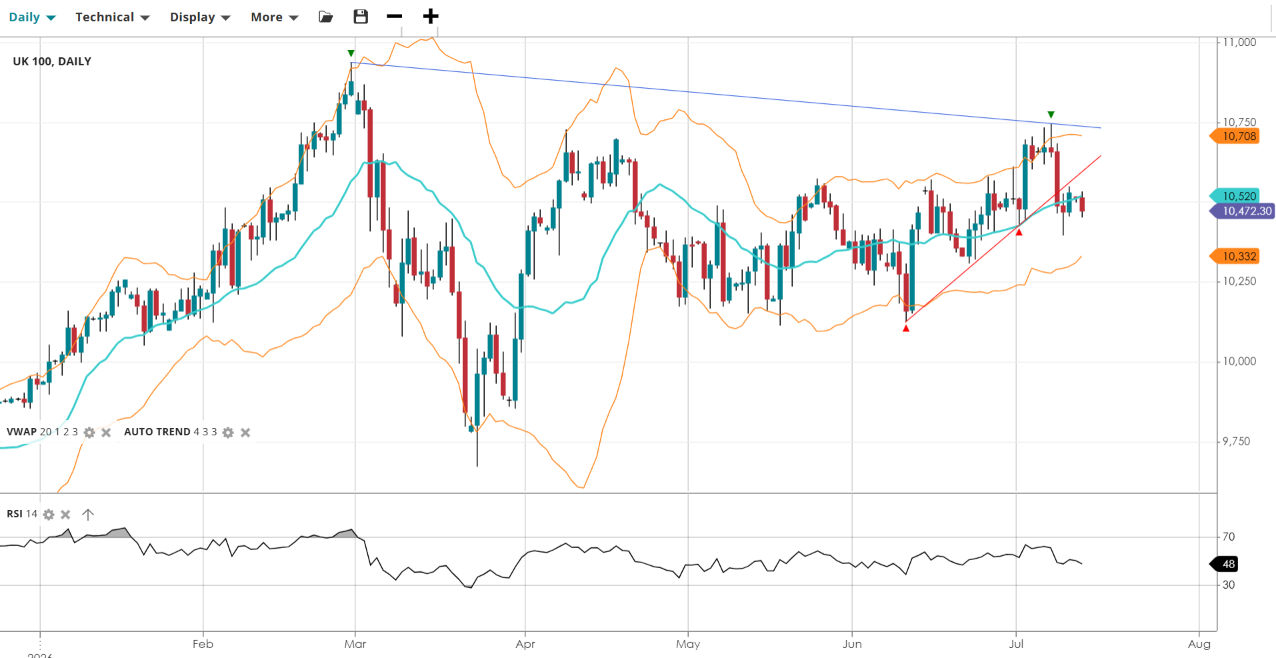
UK 100 was rejected once again at the long-standing descending trendline resistance from the March high, and has since fallen back below VWAP and through the rising trendline that had supported the advance from the July low. This leaves the index sitting at a confluence of support just above 10,332, with a neutral RSI reflecting the loss of short-term momentum following the failed breakout attempt.
GBP/USD
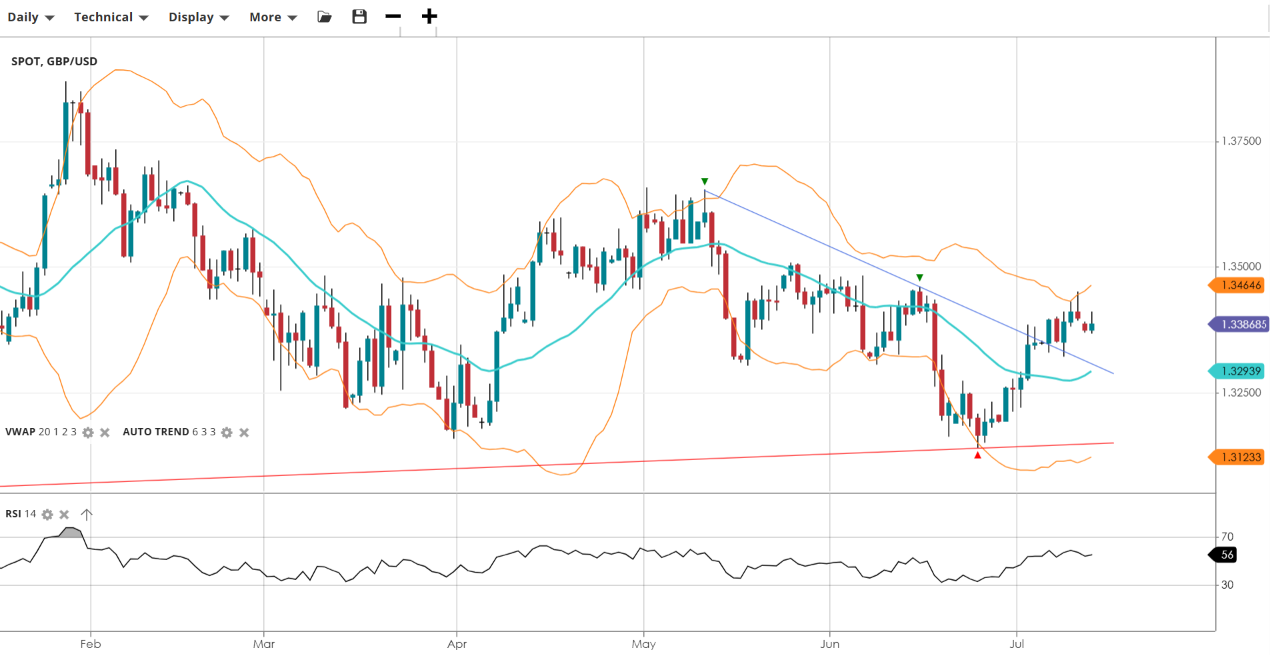
Cable's corrective rebound has continued for a second week, with price holding above VWAP and grinding higher toward the descending trendline resistance from the May high. The recovery remains constructive, with RSI firming into the mid-50s, though the pair is now approaching the same trendline that capped the previous bounce attempt, making this a key level to watch for either a breakout or renewed rejection.
EUR/USD
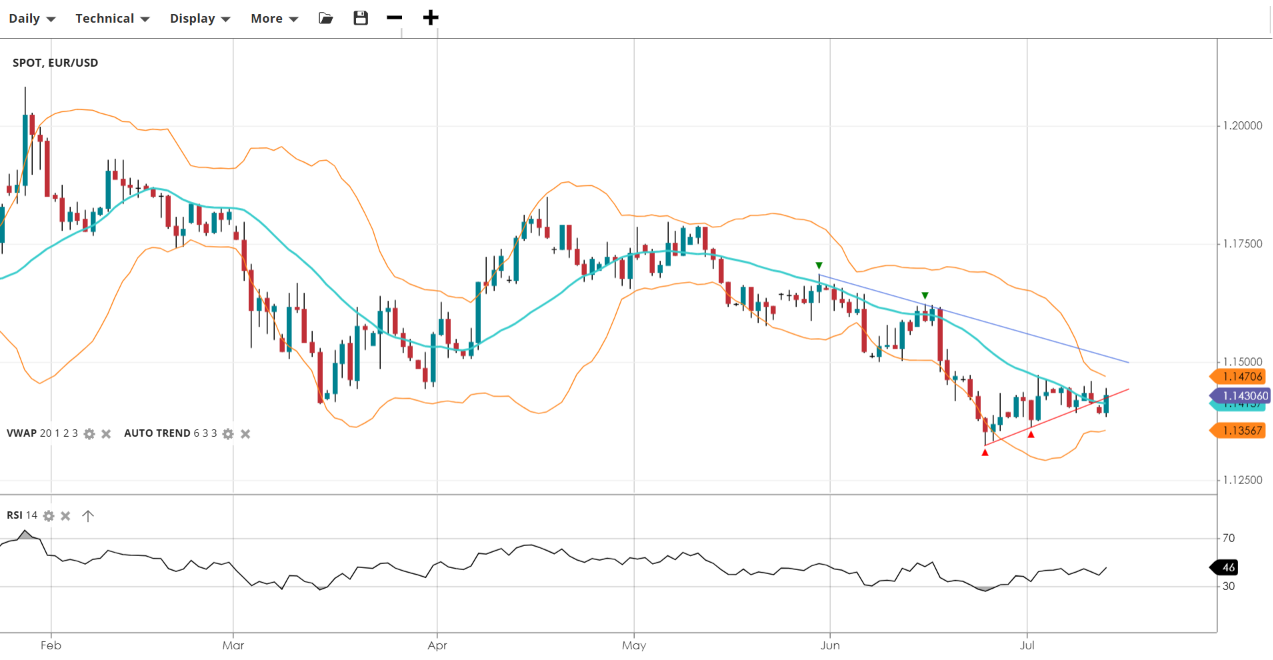
EUR/USD is consolidating in a tightening symmetrical triangle, with the descending trendline from the June high converging with the rising trendline from the early-July low. Price is hovering just below VWAP, and a neutral RSI reading reflects the balanced tension in the pattern. A decisive break of either trendline should signal the pair's next directional move.
USD/JPY
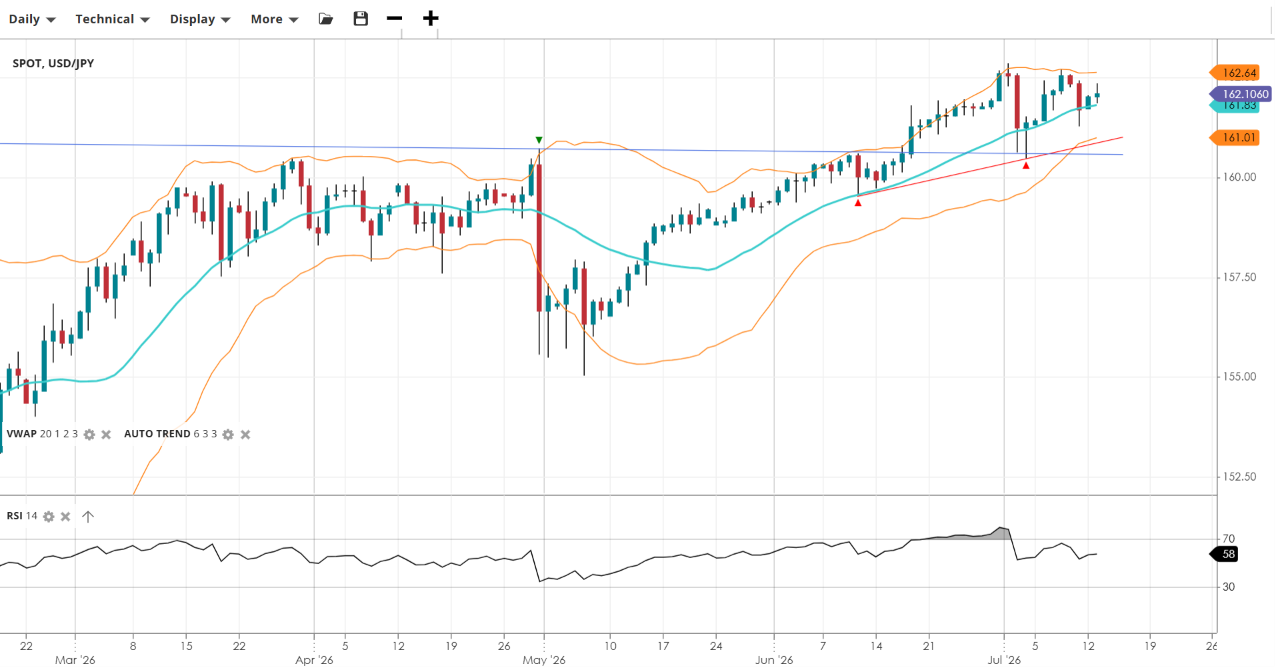
USD/JPY continues to consolidate just below its recent highs, holding above both VWAP and the rising trendline support that has underpinned the advance since May. RSI remains firm without being overbought, and the pair looks well placed to push for fresh highs provided the trendline and VWAP continue to hold on any further pullback.
Gold
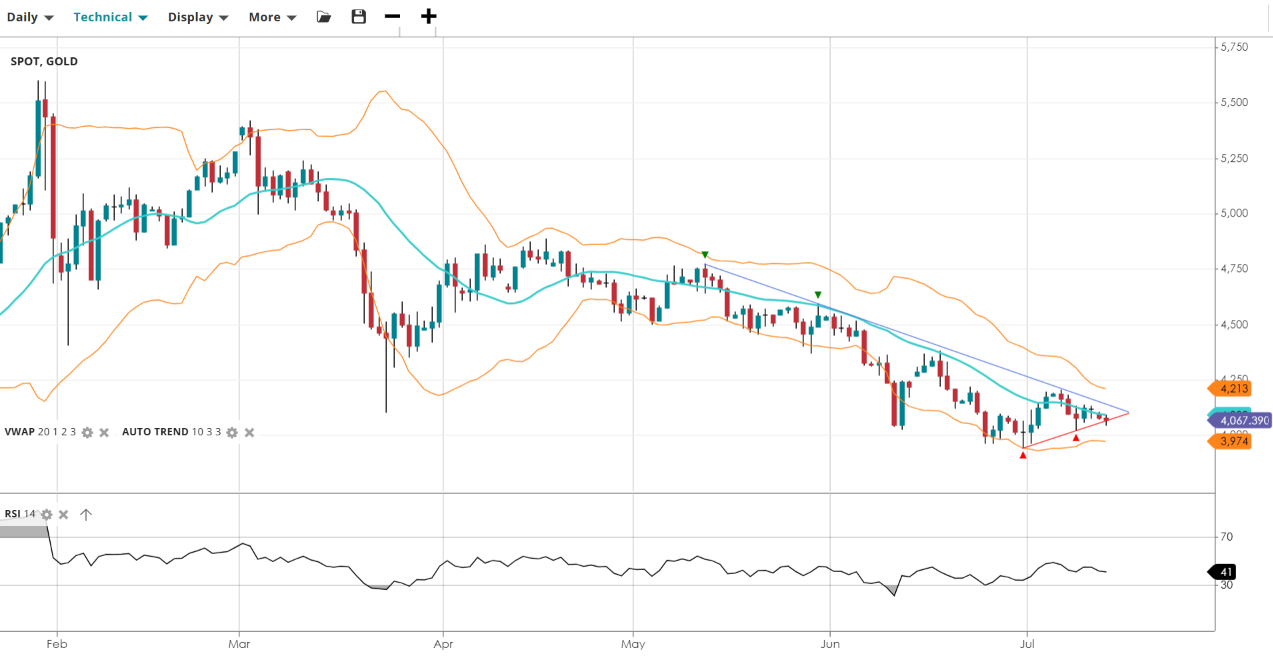
Gold remains capped within a descending wedge, with price consolidating below both VWAP and the trendline resistance drawn from the May peak, while the rising trendline from the early-July low continues to offer support underneath. RSI remains soft, in keeping with the still-bearish medium-term structure, with a break of either trendline needed to resolve the current squeeze.
Brent Crude
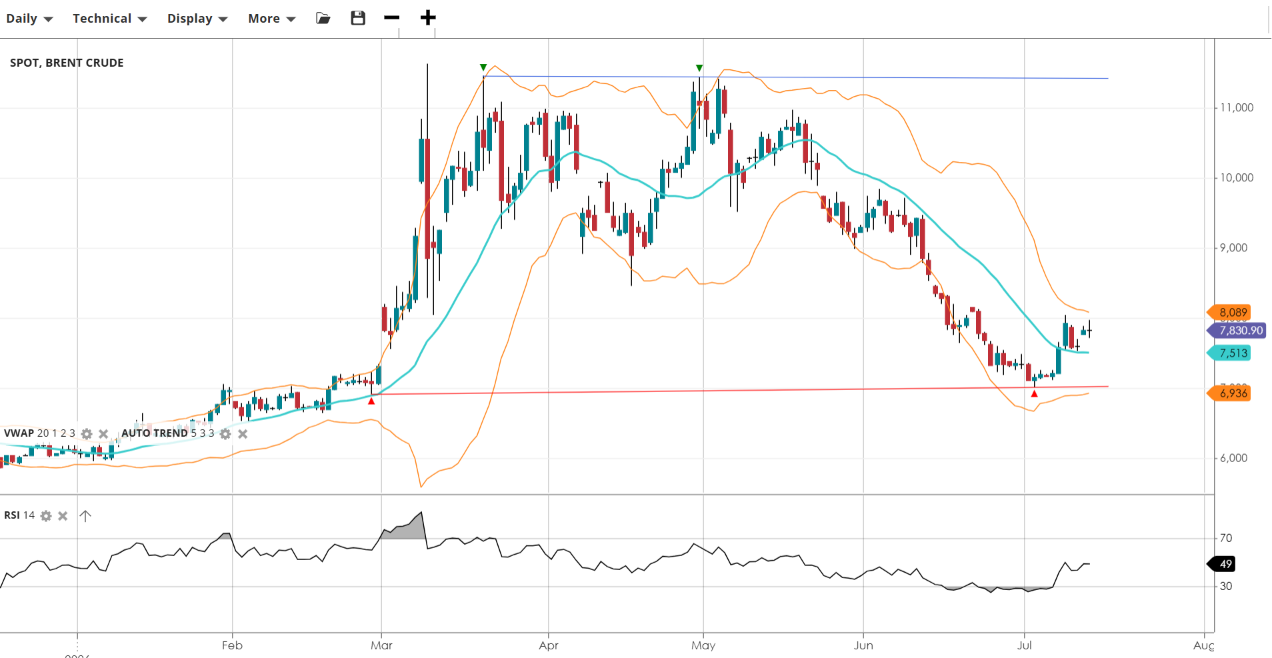
Brent has staged a sharp relief bounce off the multi-month trendline support that has now been tested and held, reclaiming VWAP in the process. RSI has recovered from deeply oversold levels back into neutral territory, supporting the case for further near-term upside, though the broader trend from the May peak remains bearish until the market can clear the horizontal resistance overhead.
It's easy to open an account
- Fill in our simple online application form
- Fund your account
- Start trading the global markets instantly!
SEARCH FOR AN ARTICLE:
Enter a keyword and search for all relevant articlesMARKET ANALYSIS
RECENT POSTS
DISCLAIMER
Spread bets and CFDs are complex instruments and come with a high risk of losing money rapidly due to leverage. 61% of retail investors lose money when trading spread bets and CFDs with this provider. You should consider whether you understand how spread bets and CFDs work and whether you can afford to take the high risk of losing your money. For professional clients, spread betting and CFD trading can also result in losses larger than your initial stake or deposit.
Spreadex Ltd is authorised and regulated by the Financial Conduct Authority, provides an execution only service and does not provide advice in any way. Nothing within this update should be deemed to constitute the provision of investment advice, recommendations, any other professional advice in any way, or a record of our trading prices. This update does not constitute or form part of an offer of, or solicitation for a transaction in any financial instrument, nor shall it or the fact of its distribution form the basis of, or be relied on in connection with, any contract therefore. Any persons placing trades based on their interpretation of the comments or information within this update does so entirely at their own risk.
No representation, warranty, or undertaking, express or limited, is given as to the accuracy or completeness of the information or opinions contained within this update by Spreadex Ltd or any of its employees and no liability is accepted by such persons for the accuracy or completeness of any such information or opinions. As such, no reliance may be placed for any purpose on the information and opinions contained within this update.
The information contained within this update is the intellectual property of Spreadex Ltd and is protected by UK and International copyright laws. All rights reserved. Users may however freely download, distribute and reproduce extracts of the contents, subject always to accrediting Spreadex Ltd as the source and providing a hyperlink to www.spreadex.com.


