Weekly Technical Analysis
Weekly Technical Analysis
Technical Analysis Weekly
Start your week by identifying the key price levels and trends.
The SpreadEx Research team has analysed the most popular markets, including stocks, indices, commodities & forex.
NOTE: These charts use the ‘Pro Trading Tools’ available on the SpreadEx trading platform. To use them, log in to your SpreadEx Financials Account and click ‘Technical’ from the menu on any chart.
WEEK COMMENCING 18th MAY 2026
Summary
| Instrument | Trend | Phase | Price | VWAP | Support | Resistance | RSI |
|---|---|---|---|---|---|---|---|
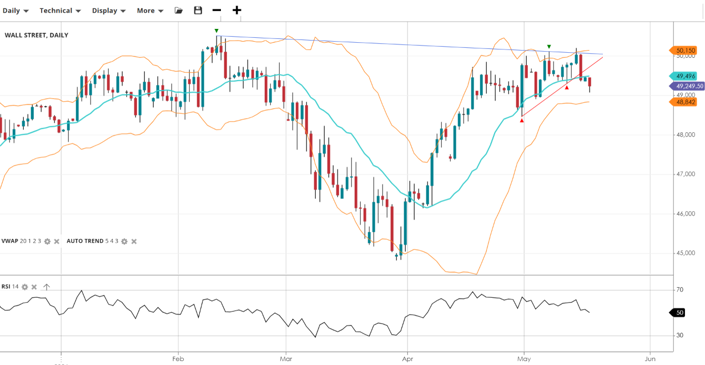
| Wall Street | Bullish | Correction | 49,250 | 49,496 | 48,842 | 50,150 | 50 |
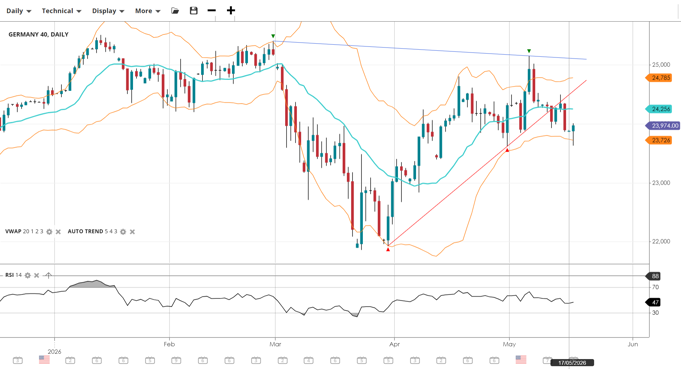
| Germany 40 | Neutral | Range | 23,974 | 24,256 | 23,726 | 24,785 | 41 |
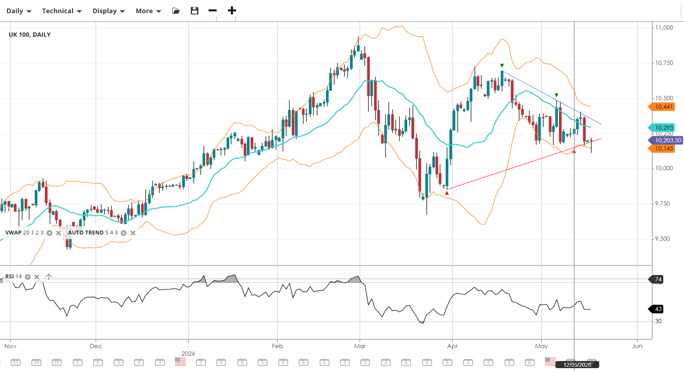
| UK 100 | Neutral | Range | 10,204 | 10,293 | 10,145 | 10,441 | 56 |
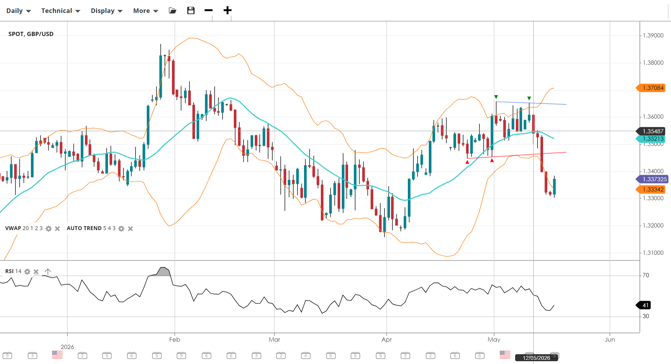
| GBP/USD | Neutral | Range | 1.3373 | 1.3521 | 1.3334 | 1.3708 | 42 |
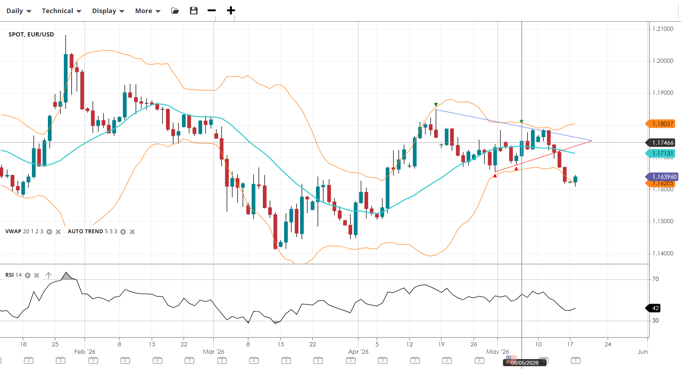
| EUR/USD | Neutral | Range | 1.1640 | 1.1713 | 1.1621 | 1.1806 | 43 |
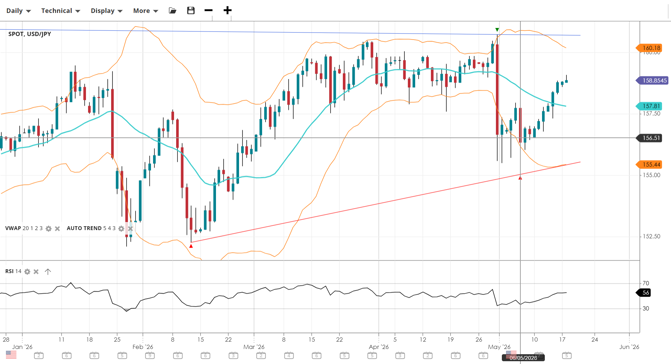
| USD/JPY | Neutral | Range | 158.85 | 157.81 | 155.44 | 160.18 | 50 |
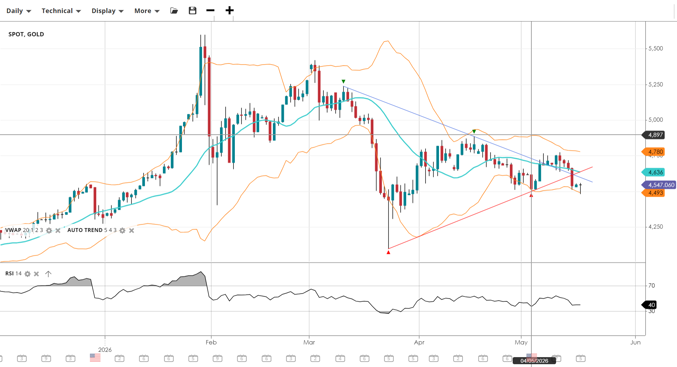
| Gold | Neutral | Range | 4,547 | 4,636 | 4,493 | 4,780 | 40 |
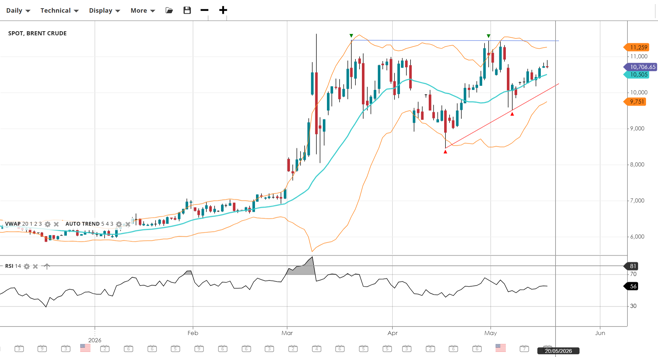
| Brent Crude | Neutral | Range | 10,707 | 10,505 | 9,751 | 11,259 | 56 |
*KEY*
- Price and 20-day VWAP at the time of writing.
- RSI level (70 is overbought and under 30 is oversold).
- Support & Resistance are set by the StdDev #2 Lower and Upper respectively.
- Trend is set by the slope of the VWAP over 50 periods.
- Phase is determined by the current price relative to the VWAP (20) level.
Analysis
Wall Street
Wall Street is correcting sideways after a strong upwards move, with price and VWAP closely aligned around 49,250. The RSI at 50 is perfectly neutral. A break above the descending trendline near 50,150 would be a significant bullish development; a break below the ascending support would shift the bias lower.
Germany 40
The Germany 40 is in a neutral range phase, trading near the VWAP between the descending upper trendline resistance and the ascending lower support trendline. The RSI at 47 reflects slightly subdued momentum. Price is coiling within this narrowing structure, and the direction of the eventual breakout will be significant for the weeks ahead.
UK 100
The UK 100 is also neutral, trading just below the VWAP as it pulls back within the descending channel formed by the upper trendline resistance and the ascending lower support trendline. The RSI at 43 reflects the corrective pressure. The broader bullish trend remains intact while ascending support holds, and a break above the descending trendline would be the key signal to re-engage the upside.
GBP/USD
GBP/USD is still rangebound but turned short term bearish, breaking sharply below the VWAP and through the ascending support trendline that had provided a floor. Price is testing the lower support band near 1.3334, with the RSI at 41 reflecting sustained selling pressure. The flat resistance near 1.3708 is now a distant target; the key downside level is around 1.32.
EUR/USD
EUR/USD is trading sideways, recently breaking below the VWAP and through the ascending support trendline after failing at the descending upper trendline resistance. Price at 1.1640 is approaching the lower support band near 1.1621, with the RSI at 42 reflecting bearish momentum. A hold at the lower band could trigger a bounce; a break below it would extend the downside toward 1.15.
USD/JPY
USD/JPY is neutral, recovering strongly above the VWAP after bouncing off the ‘intervention’ lows. Price at 158.85 has reclaimed the VWAP and is pushing toward the flat horizontal resistance near 160.18, with the RSI at 56 reflecting solid bullish momentum. The ascending support trendline continues to underpin the broader uptrend, and a break above the 160 resistance would be a significant bullish development.
Gold
Gold is neutral, trading below the VWAP but inside the tightening 2 standard deviation bands. Price has broken below the lower rising trendline, with the RSI at 40 the bias has turned bearish. The March low remains critical support.
Brent Crude
Brent Crude is in a near term bullish pullback phase, tracking above the VWAP and pressing towards the flat upper resistance trend line. The RSI at 56 reflects some bullish momentum. The ascending lower support trendline continues to provide a floor, and a sustained break above the resistance would be a significant bullish development targeting new highs.
It's easy to open an account
- Fill in our simple online application form
- Fund your account
- Start trading the global markets instantly!
SEARCH FOR AN ARTICLE:
Enter a keyword and search for all relevant articlesMARKET ANALYSIS
RECENT POSTS
DISCLAIMER
Spread bets and CFDs are complex instruments and come with a high risk of losing money rapidly due to leverage. 61% of retail investors lose money when trading spread bets and CFDs with this provider. You should consider whether you understand how spread bets and CFDs work and whether you can afford to take the high risk of losing your money. For professional clients, spread betting and CFD trading can also result in losses larger than your initial stake or deposit.
Spreadex Ltd is authorised and regulated by the Financial Conduct Authority, provides an execution only service and does not provide advice in any way. Nothing within this update should be deemed to constitute the provision of investment advice, recommendations, any other professional advice in any way, or a record of our trading prices. This update does not constitute or form part of an offer of, or solicitation for a transaction in any financial instrument, nor shall it or the fact of its distribution form the basis of, or be relied on in connection with, any contract therefore. Any persons placing trades based on their interpretation of the comments or information within this update does so entirely at their own risk.
No representation, warranty, or undertaking, express or limited, is given as to the accuracy or completeness of the information or opinions contained within this update by Spreadex Ltd or any of its employees and no liability is accepted by such persons for the accuracy or completeness of any such information or opinions. As such, no reliance may be placed for any purpose on the information and opinions contained within this update.
The information contained within this update is the intellectual property of Spreadex Ltd and is protected by UK and International copyright laws. All rights reserved. Users may however freely download, distribute and reproduce extracts of the contents, subject always to accrediting Spreadex Ltd as the source and providing a hyperlink to www.spreadex.com.


