Weekly Technical Analysis
Technical Analysis Weekly
Start your week by identifying the key price levels and trends.
The SpreadEx Research team has analysed the most popular markets, including stocks, indices, commodities & forex.
-----------------------------------------------------
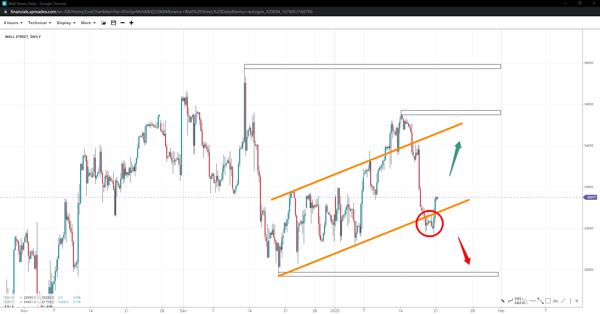
Wall Street (4 hours)
Wall Street accelerated to 34400, met stiff resistance and reversed below the base trend. The support at the 33k handle repelled bearish price action, leaving back only a failure pattern, and it is currently recovering. It could reclaim the 34k handle and upper trendline if it remains within the channel. Otherwise, slide to 32500.
Source: SpreadEx
|
Trend |
Support |
Pivot |
Resistance |
|
UP |
32500 |
33200 |
34000 |
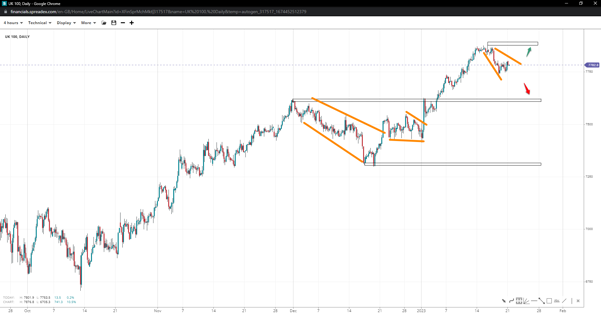
UK 100 (4 hours)
The FTSE pulled back to 7725 in what appears to be an incomplete flag pattern. If the short-term trend prevails, we could see 7690 as brief support, with 7300 major. Inversely, if a pennant pattern is completed instead, the index could break record highs once the 7875 is lost.
Source: SpreadEx
|
Trend |
Support |
Pivot |
Resistance |
|
DOWN |
7690 |
7750 |
8000 |
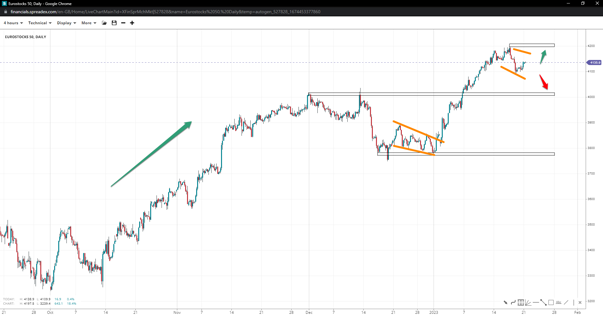
Eurostocks 50 (4 hours)
Eurostocks 50 is in a clearly defined uptrend, with the consolidation originating at 4200 forming a pennant. If the index reclaims the top, we could see the pattern come through and higher prices towards 4300. But further weakness could see a flag print instead, with the 4k handle back in the spotlight.
Source: SpreadEx
|
Trend |
Support |
Pivot |
Resistance |
|
DOWN |
4000 |
4100 |
4300 |
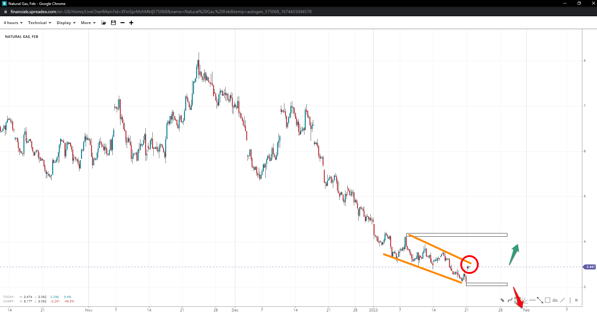
Natural gas (4 hours)
Natural gas remains heavily downward but recently printed a wedge pattern with a trough at 3.10. If prices break above the upper trendline, the commodity could revisit 4.20, but in case bulls receive a rejection, the trend may recommence past 3.10 and towards 2.00.
Source: SpreadEx
|
Trend |
Support |
Pivot |
Resistance |
|
UP |
2.00 |
3.50 |
4.20 |
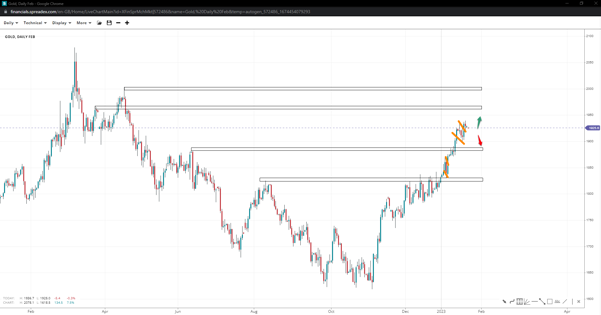
Gold (1 day)
Gold continued to ascend as it ended a short-term consolidation phase, with the 2k handle now within short-term reach. If bulls fail to take over 1965, prices could soften towards 1880 and 1825 in a downward spiral case.
Source: SpreadEx
|
Trend |
Support |
Pivot |
Resistance |
|
UP |
1825 |
1900 |
2000 |
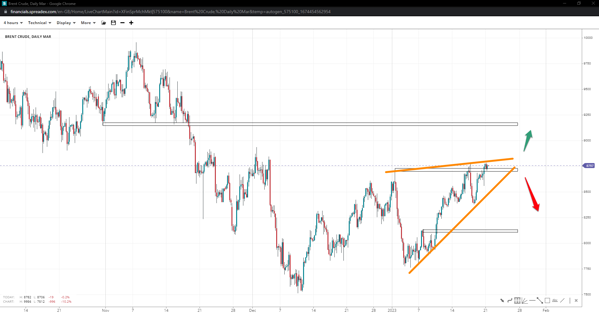
Brent Crude (4 hours)
Brent oil completed a failure pattern above its preceding two peaks, increasing the potential of a leading wedge pattern. 91.50 is short-term resistance, so long bulls defend the lower wedge trendline. Falling outside could see a deeper trough or invalidate the pattern entirely, with 81.50 back in focus. But in such case, the leading wedge might have completed the week before, and this leg up is a bullish impulse, simply in correction.
Source: SpreadEx
|
Trend |
Support |
Pivot |
Resistance |
|
DOWN |
81.50 |
86.00 |
91.50 |
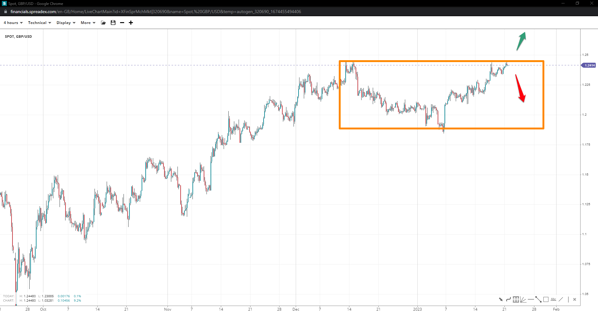
GBP/USD (4 hours)
Cable recently formed a double top with increasing chances of turning price action into a larger range. 1.2450 is significant resistance, and if breached, it could initially open the door to 1.2600 and beyond. But if bearish bets weigh on, the pair could revisit the range low at 1.1875, with temporary supports at 1.2290 and 1.2080.
Source: SpreadEx
|
Trend |
Support |
Pivot |
Resistance |
|
DOWN |
1.2290 |
1.2357 |
1.2600 |
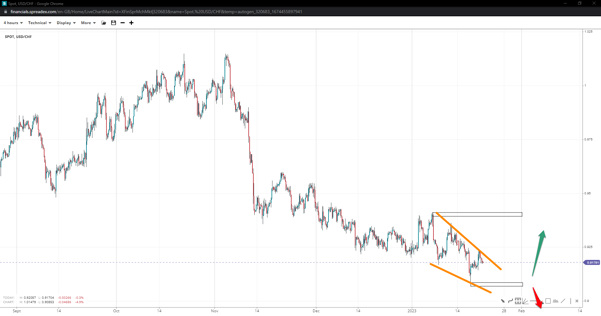
USD/CHF (4 hours)
USD/CHF price action appears overlapping, with another leg down below 0.9086, completing the pattern for a potential reversal. 0.9412 is major resistance, but in the short term, eyes will shift to 0.9240. The descent could extend as low as 0.8950 before the wedge is confirmed.
Source: SpreadEx
|
Trend |
Support |
Pivot |
Resistance |
|
DOWN |
0.8950 |
0.9180 |
0.9240 |
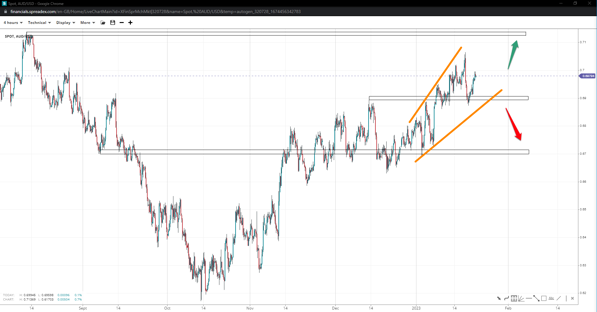
AUD/USD (4 hours)
A potential broadening wedge pattern could be in the works for Aussie, with the top at 0.7125 back on the radar so long bulls keep bears above 0.6900. Losing the stronghold could expose prices to 0.6700.
Source: SpreadEx
|
Trend |
Support |
Pivot |
Resistance |
|
UP |
0.6700 |
0.7000 |
0.7125 |
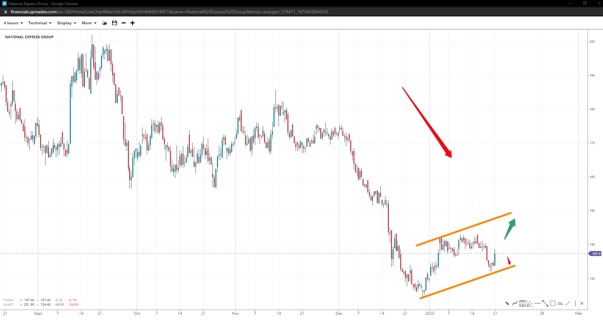
National Express (4 hours)
National Express has come off shy above the bottom of 125 but remains in a corrective pattern, either a flag or pennant. A short-term upside towards 150 to the upper channel could be seen in the former case. But if bulls fail to move past 140, bears could send prices back to the swing low, in a successful break below the lower channel near 133.

Source: SpreadEx
|
Trend |
Support |
Pivot |
Resistance |
|
UP |
125 |
135 |
150 |
It's easy to open an account
- Fill in our simple online application form
- Fund your account
- Start trading the global markets instantly!
SEARCH FOR AN ARTICLE:
Enter a keyword and search for all relevant articlesMARKET ANALYSIS
RECENT POSTS
DISCLAIMER
Spread bets and CFDs are complex instruments and come with a high risk of losing money rapidly due to leverage. 61% of retail investors lose money when trading spread bets and CFDs with this provider. You should consider whether you understand how spread bets and CFDs work and whether you can afford to take the high risk of losing your money. For professional clients, spread betting and CFD trading can also result in losses larger than your initial stake or deposit.
Spreadex Ltd is authorised and regulated by the Financial Conduct Authority, provides an execution only service and does not provide advice in any way. Nothing within this update should be deemed to constitute the provision of investment advice, recommendations, any other professional advice in any way, or a record of our trading prices. This update does not constitute or form part of an offer of, or solicitation for a transaction in any financial instrument, nor shall it or the fact of its distribution form the basis of, or be relied on in connection with, any contract therefore. Any persons placing trades based on their interpretation of the comments or information within this update does so entirely at their own risk.
No representation, warranty, or undertaking, express or limited, is given as to the accuracy or completeness of the information or opinions contained within this update by Spreadex Ltd or any of its employees and no liability is accepted by such persons for the accuracy or completeness of any such information or opinions. As such, no reliance may be placed for any purpose on the information and opinions contained within this update.
The information contained within this update is the intellectual property of Spreadex Ltd and is protected by UK and International copyright laws. All rights reserved. Users may however freely download, distribute and reproduce extracts of the contents, subject always to accrediting Spreadex Ltd as the source and providing a hyperlink to www.spreadex.com.


