Financial Trading Blog
Can the Nasdaq's Record Rally Continue in Q3?
The premier tech index rose 20% in Q2, its best performance since 2020, driven by strong fundamentals and AI demand, but cracks in the narrative are already appearing less than a week into Q3.
The Key Factors Driving the Market
- Some analysts worry that a correction is coming for the Nasdaq after seeing the strongest rally since 2020.
- Rebound sets a high bar for achieving similar performance in Q3, but some analysts remain broadly optimistic about stocks amid easing inflationary pressures.
- Recent market gains may have been driven by positive US data that has since been revised lower.
- The Fed is still in hiking mode despite easing crude prices, which could weigh on high-valuation stocks as investors are already nervous about massive hyperscaler spending.
Rally on a Mirage?
US stocks, in general, and the Nasdaq in particular, saw the best performance in years over the last three months, as optimism around the AI infrastructure buildout drew investors. The gains hark back to the rebound seen in 2020. Q2 performance also reflected a rebound after stocks fell in the first three months of the year due to AI disruption in the software industry and major risk-off sentiment following the US-led attacks on Iran. In other words, the timing already sets a high bar for the market to deliver similar performance through the summer. To complicate matters, however, one factor that analysts attributed to the gains might not have been real: Underlying US economic conditions. Markets rose in June, backed by strong Non-Farm Payrolls, but the latest data showed that both May and April reports were exaggerated. Not only did June payrolls fall well below expectations, but the prior two months' readings were revised down by 74K. The unemployment rate dropped due to 720K people leaving the workforce.
The narrative that the US economy remains resilient despite geopolitical situations took another blow last week: The Atlanta Fed slashed its Q2 GDP growth projections to just 1.2% annualised, down from over 3.0% it had been forecasting for the quarter. Meanwhile, hawkish rhetoric from the new Fed Chair has kept expectations high that the FOMC will hike later this year, raising the prospect of higher borrowing costs that could particularly affect the tech sector, which has been driving equity growth over the last few months.
Challenging, But Not Impossible Growth
On the other hand, capital spending by hyperscalers on AI infrastructure is largely locked in for the next few months, which could continue to provide optimism on that front. Analysts at JPMorgan, for example, are bullish on stocks for the rest of the year, forecasting double-digit growth in the second half. The easing of conditions in the Strait of Hormuz could lower energy costs, easing pressure on central banks to hike and improving profitability for industrials. This means equity gains could be more broad-based, supporting industrials and other sectors that were left behind by Q2's rally. But this trend could also underscore a weakness for the Nasdaq in particular, as the same Mag 7 stocks that are financing the AI infrastructure rally underperform the broader market as investors worry about the size of the capital expenditure. If there is a market for the final product as the economy continues to grow, then those concerns may be unwarranted. But if US data continues to disappoint, then the driver behind the AI boom could suffer as well, dragging the Nasdaq with it. After all, following the best gains in years, profit-taking is in order, and a correction would be in line with historical precedent.
Nasdaq in Potential Triangle Consolidation
In technical terms, the US Tech 100 has been rising throughout Q2 until it started to consolidate since the beginning of June, with price action tightening suggesting a triangle pattern. Typically, triangles are considered continuation patterns, meaning an upside breakout could take Nasdaq to new record highs above 30770, initially testing the 31K handle. However, losing 29K, a major support combining the psychological level and the lower VWAP line, would expose 28200 and, in turn, invalidate the continuation pattern, paving the way for 27K.
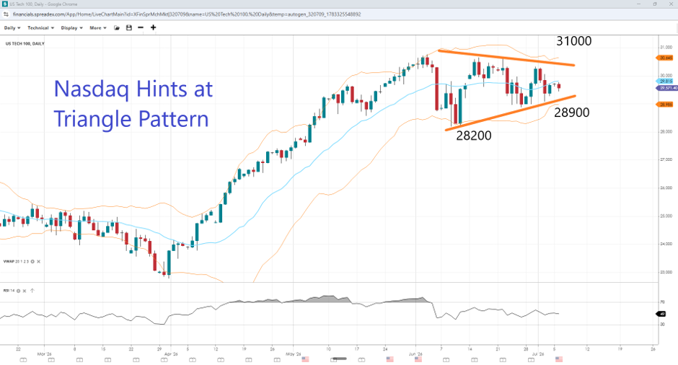
Source: SpreadEx | US Tech 100, Daily Chart
It's easy to open an account
- Fill in our simple online application form
- Fund your account
- Start trading the global markets instantly!
SEARCH FOR AN ARTICLE:
Enter a keyword and search for all relevant articlesMARKET ANALYSIS
RECENT POSTS
DISCLAIMER
Spread bets and CFDs are complex instruments and come with a high risk of losing money rapidly due to leverage. 61% of retail investors lose money when trading spread bets and CFDs with this provider. You should consider whether you understand how spread bets and CFDs work and whether you can afford to take the high risk of losing your money. For professional clients, spread betting and CFD trading can also result in losses larger than your initial stake or deposit.
Spreadex Ltd is authorised and regulated by the Financial Conduct Authority, provides an execution only service and does not provide advice in any way. Nothing within this update should be deemed to constitute the provision of investment advice, recommendations, any other professional advice in any way, or a record of our trading prices. This update does not constitute or form part of an offer of, or solicitation for a transaction in any financial instrument, nor shall it or the fact of its distribution form the basis of, or be relied on in connection with, any contract therefore. Any persons placing trades based on their interpretation of the comments or information within this update does so entirely at their own risk.
No representation, warranty, or undertaking, express or limited, is given as to the accuracy or completeness of the information or opinions contained within this update by Spreadex Ltd or any of its employees and no liability is accepted by such persons for the accuracy or completeness of any such information or opinions. As such, no reliance may be placed for any purpose on the information and opinions contained within this update.
The information contained within this update is the intellectual property of Spreadex Ltd and is protected by UK and International copyright laws. All rights reserved. Users may however freely download, distribute and reproduce extracts of the contents, subject always to accrediting Spreadex Ltd as the source and providing a hyperlink to www.spreadex.com.


