Financial Trading Blog
FTSE 100 Poised for a Breakout
The FTSE 100 has started the week above its record closing high, with only July's intraday peak left to beat.
Friday's close of 10,902.56 was the highest in three months and capped a 2.1% weekly gain. The index had been trading around 10,925 as of Monday morning, above the 10,910.55 record close set on 27 February and less than 1% below the all-time high of 10,989.45 from 31 July. What stands out is how it got here, with miners, oil majors and most of the banks falling over the past month.
Latest Market Moves
The FTSE 100 closed up 0.4% at 10,902.56, then pushed on to a high of 10,931 in early Monday trade.
The FTSE 250 fell 0.4% on Friday and is little changed over three months, a sign that the strength is concentrated in the large caps and likely not a UK-specific story.
The Nasdaq 100 closed down 1.2% at 27,944 on Friday, leaving it almost 8% lower over a month, while the S&P 500 slipped 0.4% to 7,562.
GBP/USD was hovering near 1.32 heading into Monday's session, down about 2.4% over three months.
Brent was changing hands at roughly $95.50 a barrel on Monday morning, around 10% lower over a month, and Gold was near $3,860, down more than 7% over the same period.
Macro Drivers: AI Wobble, Weak Pound, Solid Growth
The biggest macro driver is not British at all.
Nvidia shares have fallen about 28% in a month amid a board investigation into its chief executive, and the sell-off has spread across US and Asian technology stocks. Japan's Nikkei 225 closed 2.4% lower on Monday and South Korea's Kospi lost 3.6%. The FTSE 100 has very little technology weighting, and is up around 1% over the same month.
Sterling is the second support. The Bank of England raised Bank Rate to 4% on 5 November in an 8-1 vote, its first increase since August 2023, yet the pound has still drifted lower against the dollar. Around three-quarters of FTSE 100 revenue is earned overseas, so a weaker pound lifts the sterling value of those earnings.
The domestic picture has also held up. UK GDP grew 0.7% in the third quarter, up from 0.5% in the second. Governor Andrew Bailey has said the November hike is unlikely to be the last unless the Iran conflict is resolved, which puts this week's UK inflation and jobs data in focus.
Micro Drivers: Defensives Are Doing the Heavy Lifting
Stock by stock, the gains have come from a fairly narrow group of defensive heavyweights.
AstraZeneca, one of the three largest companies in the index, is up about 12% in a month and 21% in three months. Third-quarter results on 30 October showed revenue up 7% to $16.21bn and core earnings of $2.79 a share, with full-year guidance reiterated. On Monday it announced EU and US approvals for Klygefa, a treatment for generalised myasthenia gravis.
It has had company. London Stock Exchange Group has gained about 13% over the month, Diageo 11%, British American Tobacco 8%, and National Grid and RELX around 7% each. Marks & Spencer is up roughly 14% and set a new 52-week high on Monday.
Last week's 2.1% rise was broader. Rolls-Royce and Marks & Spencer each added about 7%, the former after holding its full-year guidance and bringing forward a £1.5bn buyback, and HSBC, the largest stock in the index, gained almost 4%.
What Is Holding the Index Back
The FTSE 100 is knocking on the door of a record with several of its biggest sectors going the wrong way.
Glencore is down about 13% over the month, Antofagasta 10%, Anglo American 9% and Rio Tinto 8%, while the slide in gold has taken Fresnillo 11% lower. Shell and BP have each lost 4% to 5% as Brent pulled back, although both are still up more than 30% this year. NatWest has dropped close to 10% and HSBC is 5% lower, even after last week's bounce.
That leaves the advance reliant on a handful of names, which cuts both ways. The next tests come quickly: Nvidia reports on Tuesday, UK inflation and employment figures follow, and the Iran war is on the agenda for a planned meeting between Donald Trump, Vladimir Putin and Xi Jinping in Shenzhen.
FTSE 100 Technical Analysis: Ascending Triangle Below 11,000
The weekly chart shows an ascending triangle, a flat ceiling with rising lows underneath it.
The ceiling is defined by February's high, the record of 10,989.45 on 31 July and a spike on 5 November. On a closing basis it is tighter still, with the weekly closes all within ten points of each other. The index has never traded at 11,000.
The floor is a trendline rising from the June 2025 lows through the lows of March, October and 6 November. Each pullback from the ceiling has been shallower than the last, at 11.6%, 5.7% and 3.8%. The weekly RSI is around 59, having turned up from the 50 line in both March and October, and is well short of the overbought readings seen in February.
A weekly close above 10,910.55 would be the first sign of a breakout, with the 10,989.45 record and the 11,000 round number the levels beyond it. If the ceiling holds for a fourth time, the trendline comes in at roughly 10,500 to 10,550, ahead of the October low.
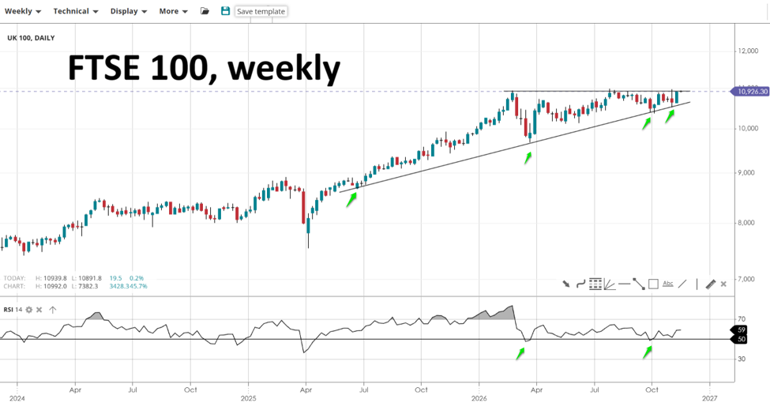
Source: SpreadEx | FTSE 100, Weekly Chart
It's easy to open an account
- Fill in our simple online application form
- Fund your account
- Start trading the global markets instantly!
SEARCH FOR AN ARTICLE:
Enter a keyword and search for all relevant articlesMARKET ANALYSIS
RECENT POSTS
DISCLAIMER
Spread bets and CFDs are complex instruments and come with a high risk of losing money rapidly due to leverage. 64% of retail investors lose money when trading spread bets and CFDs with this provider. You should consider whether you understand how spread bets and CFDs work and whether you can afford to take the high risk of losing your money. For professional clients, spread betting and CFD trading can also result in losses larger than your initial stake or deposit.
Spreadex Ltd is authorised and regulated by the Financial Conduct Authority, provides an execution only service and does not provide advice in any way. Nothing within this update should be deemed to constitute the provision of investment advice, recommendations, any other professional advice in any way, or a record of our trading prices. This update does not constitute or form part of an offer of, or solicitation for a transaction in any financial instrument, nor shall it or the fact of its distribution form the basis of, or be relied on in connection with, any contract therefore. Any persons placing trades based on their interpretation of the comments or information within this update does so entirely at their own risk.
No representation, warranty, or undertaking, express or limited, is given as to the accuracy or completeness of the information or opinions contained within this update by Spreadex Ltd or any of its employees and no liability is accepted by such persons for the accuracy or completeness of any such information or opinions. As such, no reliance may be placed for any purpose on the information and opinions contained within this update.
The information contained within this update is the intellectual property of Spreadex Ltd and is protected by UK and International copyright laws. All rights reserved. Users may however freely download, distribute and reproduce extracts of the contents, subject always to accrediting Spreadex Ltd as the source and providing a hyperlink to www.spreadex.com.


