Financial Trading Blog
FTSE 100 Shows Relative Strength in Tech Sell-Off
The FTSE 100 has held up far better than Wall Street and Europe as doubts over AI spending have rattled tech stocks this month.
Since the Nasdaq 100 hit a record on 6 October, it has dropped more than 7% and the S&P 500 has lost around 2%, while the FTSE 100 is still up more than 1%. The UK index has slipped this week as banks and miners came under pressure, but on the days when AI-led selling has been heaviest it has barely moved.
Latest Market Moves
The FTSE 100 dipped just 0.3% on Thursday as the Nasdaq 100 fell 2.9%, the DAX lost 1.1% and the S&P 500 dropped 1.2%. The UK index was edging lower around 10,700 in early Friday trade.
Since 6 October, the FTSE 100 is up about 1.4%, compared with falls of 1% for the DAX, 2% for the S&P 500 and more than 7% for the Nasdaq 100.
The Philadelphia Semiconductor Index plunged 6.7% on Thursday after Meta raised its 2026 spending forecast to between $135 billion and $145 billion, with Meta down nearly 7% and Nvidia 4.4% lower.
Brent crude was trading above $113 a barrel heading into Friday's European session, up nearly 8% this week, with BP and Shell rising again in early trade.
UK-listed defensives rallied on Thursday, with Unilever up 3.2%, AstraZeneca 2.9% higher and Diageo gaining 2.8%, while LSEG jumped 8% after raising its full-year guidance.
Light on Tech, Heavy on Value
The FTSE 100's biggest advantage in an AI sell-off is simply what it doesn't own.
The index has no equivalent of Nvidia, Broadcom or the hyperscalers, and is dominated instead by oil majors, banks, pharmaceutical groups, consumer staples and miners. The tech-related names it does have, such as LSEG, RELX and Sage, are software and data businesses rather than chipmakers or companies spending heavily on AI infrastructure.
That mix has shown up again and again on the worst days for US tech. On seven of the Nasdaq 100's eight biggest daily falls since June, the FTSE 100 finished flat or higher, including 5 June, when the Nasdaq 100 slumped 4.8% and the UK index edged up.
Oil Rally Lifts the Energy Majors
Rising oil prices have given the FTSE 100 a further cushion that US and German indices lack.
Brent has climbed around 16% over the past month as tensions in the Middle East escalated, with Houthi attacks in Saudi Arabia on Thursday and reports that the US and Israel are planning renewed strikes on Iran pushing prices higher again. BP and Shell, both among the index's heaviest weights, are each up more than 11% over the same period.
Consumer staples and healthcare have also benefited as investors rotated into defensive sectors on both sides of the Atlantic. British American Tobacco, Imperial Brands, Unilever and Tesco have all gained over the past month while US tech has slid.
Banks and Miners Are the Weak Spots
The FTSE 100 hasn't been immune, though, and banks have turned from a source of support into a drag.
Higher-for-longer interest rates would normally help lenders' margins, but reports that Chancellor John Healey plans to raise taxes on banks in this month's Budget have weighed on the sector.
Over the past month, Standard Chartered is down around 14%, Barclays 13%, HSBC 11% and NatWest 10%, with Barclays also announcing plans this week to cut around 5,000 jobs through AI-driven efficiencies.
Miners have also been hit by falling copper and gold prices, with Fresnillo, Antofagasta and Anglo American all dropping more than 5% on Thursday. Rolls-Royce has lost more than 11% this week, which together with the banks and miners explains why the FTSE 100 has slipped around 2% since last Friday.
FTSE 100 Technical View
The FTSE 100 remains in a long-term uptrend on the weekly chart, despite stalling for most of this year.
The index has repeatedly failed just below 11,000 since late February, while a rising trendline from mid-2025 has caught each pullback, including this month's dip. That combination of a flat ceiling and rising lows forms an ascending triangle, a pattern that often resolves to the upside, and the weekly RSI sits around 53, leaving plenty of room in either direction.
A weekly close above 11,000 would mark a breakout to fresh record highs. A break below the trendline would bring the 10,000 level back into view.
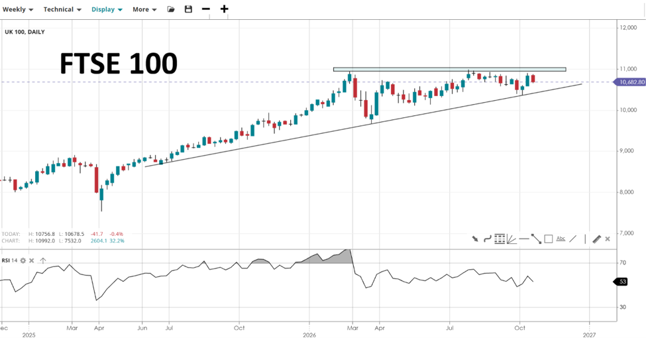
Source: SpreadEx | UK 100, Weekly Chart
It's easy to open an account
- Fill in our simple online application form
- Fund your account
- Start trading the global markets instantly!
SEARCH FOR AN ARTICLE:
Enter a keyword and search for all relevant articlesMARKET ANALYSIS
RECENT POSTS
DISCLAIMER
Spread bets and CFDs are complex instruments and come with a high risk of losing money rapidly due to leverage. 61% of retail investors lose money when trading spread bets and CFDs with this provider. You should consider whether you understand how spread bets and CFDs work and whether you can afford to take the high risk of losing your money. For professional clients, spread betting and CFD trading can also result in losses larger than your initial stake or deposit.
Spreadex Ltd is authorised and regulated by the Financial Conduct Authority, provides an execution only service and does not provide advice in any way. Nothing within this update should be deemed to constitute the provision of investment advice, recommendations, any other professional advice in any way, or a record of our trading prices. This update does not constitute or form part of an offer of, or solicitation for a transaction in any financial instrument, nor shall it or the fact of its distribution form the basis of, or be relied on in connection with, any contract therefore. Any persons placing trades based on their interpretation of the comments or information within this update does so entirely at their own risk.
No representation, warranty, or undertaking, express or limited, is given as to the accuracy or completeness of the information or opinions contained within this update by Spreadex Ltd or any of its employees and no liability is accepted by such persons for the accuracy or completeness of any such information or opinions. As such, no reliance may be placed for any purpose on the information and opinions contained within this update.
The information contained within this update is the intellectual property of Spreadex Ltd and is protected by UK and International copyright laws. All rights reserved. Users may however freely download, distribute and reproduce extracts of the contents, subject always to accrediting Spreadex Ltd as the source and providing a hyperlink to www.spreadex.com.


