Financial Trading Blog
Alphabet Shares Fall Out of Bed. AI Trade Over?
Alphabet suffered the worst day in its history as a listed company on Thursday, with the shares sliding 12.6% after third-quarter results put both its search business and its AI spending under the microscope.
Revenue of $127.6 billion missed forecasts, search growth slowed for a second straight quarter and capital expenditure more than doubled from a year ago. The sell-off wiped around half a trillion dollars off the company's market value and dragged the wider tech sector down with it.
Latest Market Moves
Alphabet Class A shares closed Thursday at $283.82, down 12.6% in their biggest one-day fall since the 2004 listing, and were little changed in early Friday pre-market trade.
The Nasdaq 100 fell 1.4% on Thursday, and Nasdaq 100 futures were down more than 2% heading into Friday's session as results from Amazon and Intel added to the pressure.
Amazon was trading around 6% lower in pre-market after its results, while Intel slumped around 25% on a weak current-quarter forecast.
In Asia, the Kospi slumped 3.5% and the Nikkei 225 lost 2.1% on Friday as the AI sell-off went global.
Bonds caught a bid, with the US 10-year Treasury yield slipping to around 4.92% as of Friday morning.
Search Miss Raises the Big Question
Search is where the real damage was done.
Revenue from Google Search rose 12% to $63.4 billion, short of the 15% growth expected and down from 19% in the first quarter and 17% in the second. YouTube advertising growth also cooled to 9%, from 13% in the prior quarter.
That matters because search is still Alphabet's cash machine, and the market's fear is that AI chatbots are slowly eating into it. CFO Anat Ashkenazi flagged tougher comparisons ahead, saying "we will begin lapping an acceleration in Search performance that began in the third quarter last year."
The AI Spending Bill Keeps Growing
The other problem is the sheer scale of the spending.
Capex came in at $51.4 billion in the quarter, more than double the $24 billion spent a year earlier, pushing free cash flow into negative territory at minus $9.1 billion. Alphabet kept its 2026 capex guidance at $195 billion to $205 billion, but Ashkenazi said spending is expected to "increase significantly in 2027."
Alphabet is not alone. Amazon is sticking with its $220 billion capex plan for 2026 and Meta lifted the bottom of its 2026 range to $135 billion, so investors are asking harder questions about when the returns will show up.
Cloud Offers the Bull Case
Not everything in the report was bad.
Google Cloud revenue more than doubled, up 103% to $30.7 billion, with the unit's operating margin widening to 36.2% from 23.7% a year ago. CEO Sundar Pichai pointed to "huge demand for our AI infrastructure and AI solutions" and said the group is "now on a half-trillion dollar revenue run rate."
That is the crux of the buy-the-dip debate. If cloud keeps growing at this pace the spending starts to look justified, but if search keeps slowing at the same time, the market may keep marking down what it is willing to pay for the shares.
Alphabet Technical View: Trendline Break Puts 50% Retracement in Play
The chart was already flashing a warning before the results.
Earlier this month, the shares slipped below the rising trendline that had supported the rally since the April 2025 low and held at the March 2026 low. Thursday's gap lower then took the price straight through the 38.2% Fibonacci retracement of the move from the April 2025 low to the May 2026 high, around $305.
The next level to watch is the 50% retracement near $274, roughly 3% below where the shares were trading in Friday's pre-market. That level also lines up closely with the March 2026 low at $272, making it a key support zone. A break below there would open the way to the 61.8% level around $242.
On the other side, the 14-day RSI has dropped to around 22, its lowest reading in two years. The previous two dips below 30, in March 2025 and late March 2026, came close to major lows, although in 2025 the shares took a few more weeks to find a floor. Any rebound would likely run into resistance at the broken trendline and the 38.2% level around $305.
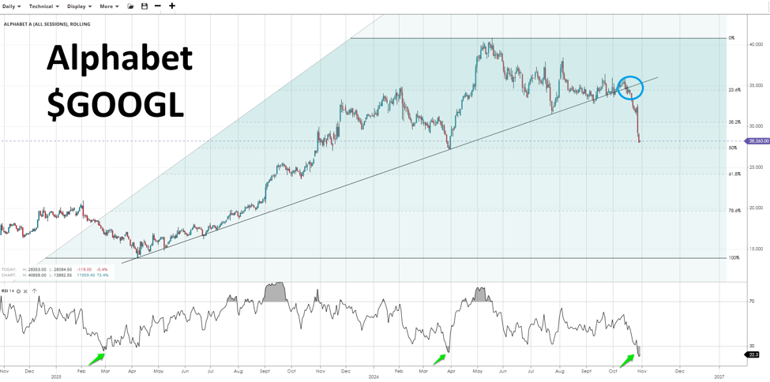
Source: SpreadEx | Alphabet A, Daily Chart
It's easy to open an account
- Fill in our simple online application form
- Fund your account
- Start trading the global markets instantly!
SEARCH FOR AN ARTICLE:
Enter a keyword and search for all relevant articlesMARKET ANALYSIS
RECENT POSTS
DISCLAIMER
Spread bets and CFDs are complex instruments and come with a high risk of losing money rapidly due to leverage. 64% of retail investors lose money when trading spread bets and CFDs with this provider. You should consider whether you understand how spread bets and CFDs work and whether you can afford to take the high risk of losing your money. For professional clients, spread betting and CFD trading can also result in losses larger than your initial stake or deposit.
Spreadex Ltd is authorised and regulated by the Financial Conduct Authority, provides an execution only service and does not provide advice in any way. Nothing within this update should be deemed to constitute the provision of investment advice, recommendations, any other professional advice in any way, or a record of our trading prices. This update does not constitute or form part of an offer of, or solicitation for a transaction in any financial instrument, nor shall it or the fact of its distribution form the basis of, or be relied on in connection with, any contract therefore. Any persons placing trades based on their interpretation of the comments or information within this update does so entirely at their own risk.
No representation, warranty, or undertaking, express or limited, is given as to the accuracy or completeness of the information or opinions contained within this update by Spreadex Ltd or any of its employees and no liability is accepted by such persons for the accuracy or completeness of any such information or opinions. As such, no reliance may be placed for any purpose on the information and opinions contained within this update.
The information contained within this update is the intellectual property of Spreadex Ltd and is protected by UK and International copyright laws. All rights reserved. Users may however freely download, distribute and reproduce extracts of the contents, subject always to accrediting Spreadex Ltd as the source and providing a hyperlink to www.spreadex.com.


