Weekly Technical Analysis
Weekly Technical Analysis
Technical Analysis Weekly
Start your week by identifying the key price levels and trends.
The SpreadEx Research team has analysed the most popular markets, including stocks, indices, commodities & forex.
NOTE: These charts use the ‘Pro Trading Tools’ available on the SpreadEx trading platform. To use them, log in to your SpreadEx Financials Account and click ‘Technical’ from the menu on any chart.
WEEK COMMENCING 16TH FEBRUARY 2026
Summary
Instrument |
Trend |
Phase |
Price |
VWAP |
Support |
Resistance |
RSI |
|---|---|---|---|---|---|---|---|
Wall Street |
Bullish |
Pullback |
49,656 |
49,379 |
48,361 |
50,396 |
54 |
Germany 40 |
Bullish |
Correction |
24,893 |
24,758 |
24,363 |
25,153 |
52 |
UK 100 |
Bullish |
Impulsive |
10,472 |
10,312 |
10,063 |
10,560 |
62 |
GBP/USD |
Bullish |
Pullback |
1.3637 |
1.3672 |
1.3522 |
1.3822 |
53 |
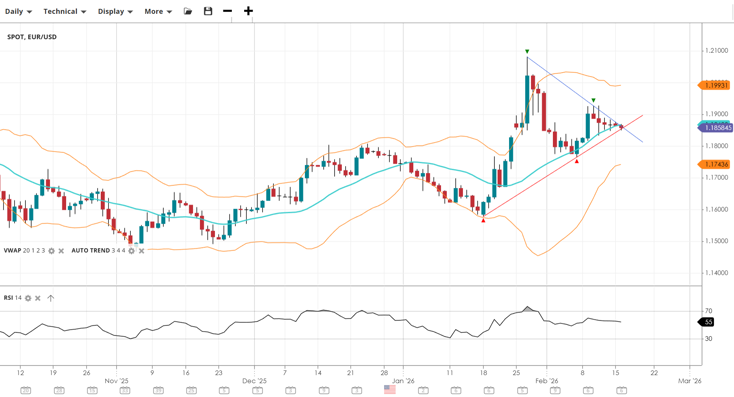
EUR/USD |
Bullish |
Consolidation |
1.1858 |
1.1852 |
1.1744 |
1.1993 |
55 |
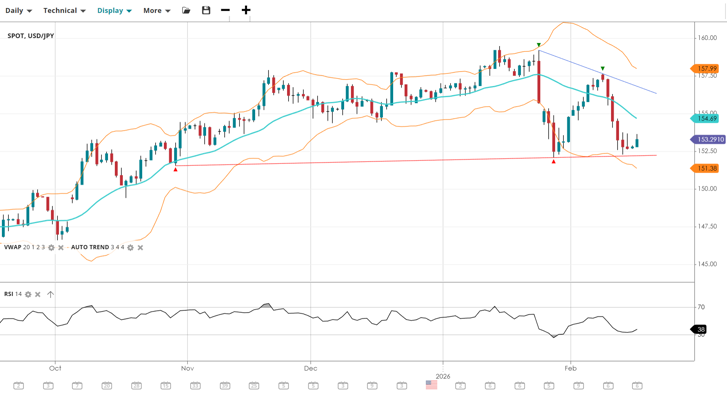
USD/JPY |
Sideways |
Range |
153.29 |
154.69 |
151.38 |
157.99 |
38 |
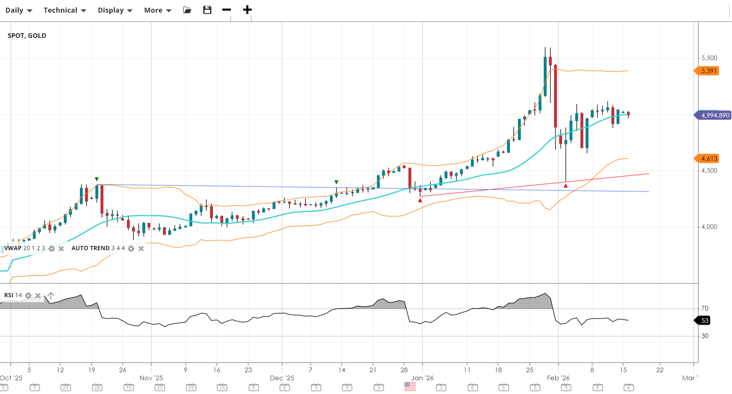
Gold |
Sideways |
Range |
4,994 |
4,990 |
4,613 |
5,391 |
53 |
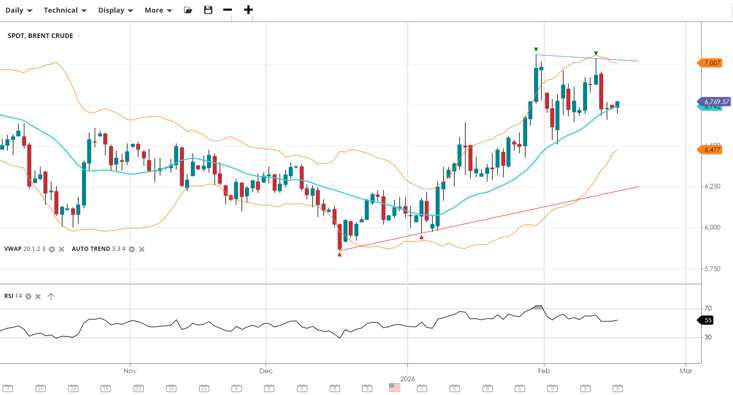
Brent Crude |
Bullish |
Pullback |
6,769 |
6,742 |
6,477 |
7,007 |
55 |
*KEY*
- Price and 20-day VWAP at the time of writing.
- RSI level (70 is overbought and under 30 is oversold).
- Support & Resistance are set by the StdDev #2 Lower and Upper respectively.
- Trend is set by the slope of the VWAP over 50 periods.
- Phase is determined by the current price relative to the VWAP (20) level.
Analysis
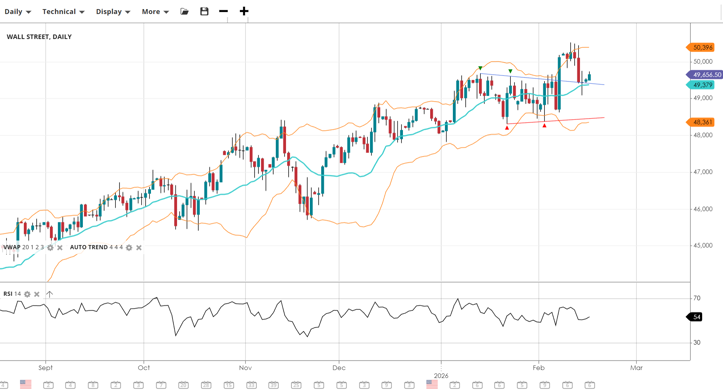
Wall Street
Wall Street has pulled back from its recent attempt at the 50k resistance level and is now consolidating. It remains above the VWAP, maintaining its broader bullish structure. RSI has cooled to 54, suggesting a transition from aggressive buying to a more neutral, healthy consolidation phase.
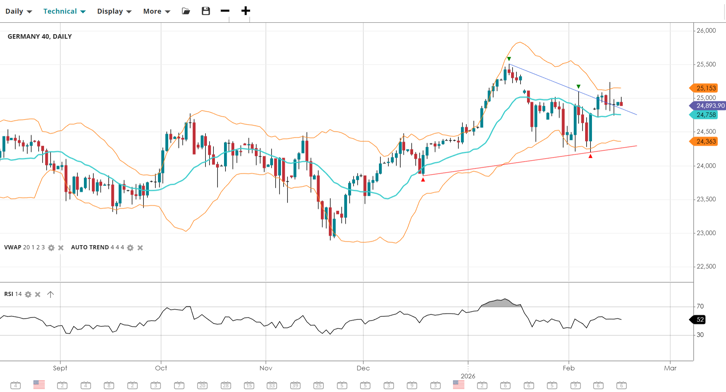
Germany 40
The Germany 40 continues to hover just below the 25k psychological level. It has successfully stayed above the VWAP of 24,758 following its recent correction. With the RSI sitting at 52, momentum is neutral-to-positive as the index looks for a catalyst to break toward the upper resistance band at 25,153.
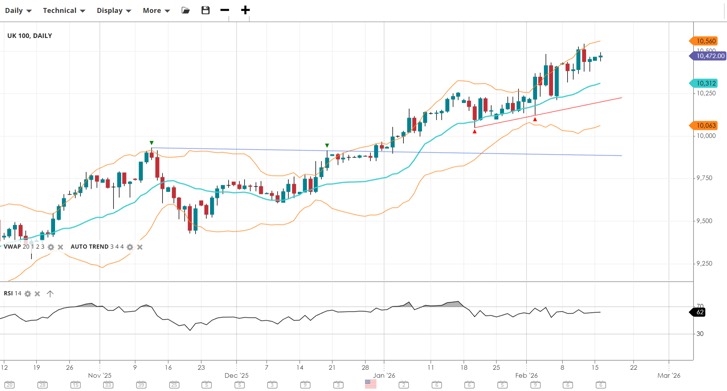
UK 100
The UK 100 is currently the standout performer, trading in an impulsive phase near all-time highs. It is well above its VWAP (10,312), and the RSI of 62 indicates strong buying pressure. Resistance is now eyed at the 10,560 level, while support has moved up significantly to 10,063.
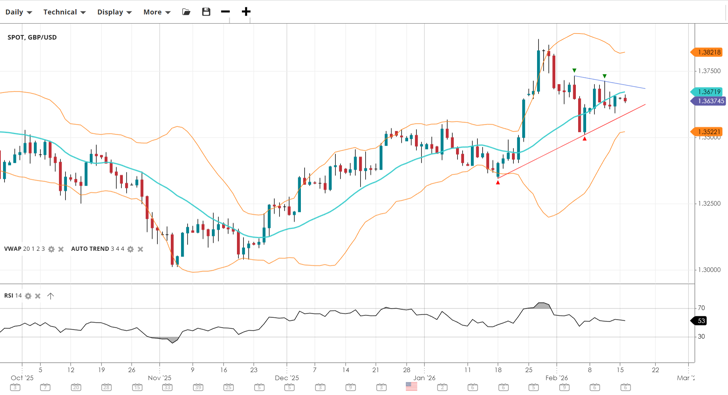
GBP/USD
GBP/USD has dipped slightly below the 20-day VWAP (1.3672) as it undergoes a shallow pullback. Despite this, the RSI remains above 50, and the long-term trend remains bullish. Support at 1.3522 remains the key floor for bulls to defend to keep the uptrend intact.
EUR/USD
EUR/USD is tightly wound around its VWAP of 1.1852, showing signs of heavy consolidation after its recent volatility. The RSI at 55 confirms a slight bullish bias, but the pair is currently trapped in a narrow range between the 1.1744 support and 1.1993 resistance.
USD/JPY
USD/JPY remains in a sideways trend but is showing increasing bearish momentum, with price now trading below the VWAP (154.69). The RSI has dropped to 38, signaling that selling pressure is rising. A test of the major support at 151.38 could be on the cards if the price cannot reclaim the VWAP.
Gold
Gold has stabilised following the extreme volatility seen in early February. It is trading back above the 4,900 level and the VWAP (4,923). Momentum has recovered with the RSI at 53, suggesting the worst of the sell-off may be over, though resistance at 5,391 remains a significant hurdle.
Brent Crude
Brent Crude is holding its bullish breakout, though price action has become more range-bound. It continues to trade just above the VWAP of 6,742. With an RSI of 55, the uptrend is still valid, though the $70.00 level (7,007 on the chart) remains a formidable resistance zone.
It's easy to open an account
- Fill in our simple online application form
- Fund your account
- Start trading the global markets instantly!
SEARCH FOR AN ARTICLE:
Enter a keyword and search for all relevant articlesMARKET ANALYSIS
RECENT POSTS
DISCLAIMER
Spread bets and CFDs are complex instruments and come with a high risk of losing money rapidly due to leverage. 61% of retail investors lose money when trading spread bets and CFDs with this provider. You should consider whether you understand how spread bets and CFDs work and whether you can afford to take the high risk of losing your money. For professional clients, spread betting and CFD trading can also result in losses larger than your initial stake or deposit.
Spreadex Ltd is authorised and regulated by the Financial Conduct Authority, provides an execution only service and does not provide advice in any way. Nothing within this update should be deemed to constitute the provision of investment advice, recommendations, any other professional advice in any way, or a record of our trading prices. This update does not constitute or form part of an offer of, or solicitation for a transaction in any financial instrument, nor shall it or the fact of its distribution form the basis of, or be relied on in connection with, any contract therefore. Any persons placing trades based on their interpretation of the comments or information within this update does so entirely at their own risk.
No representation, warranty, or undertaking, express or limited, is given as to the accuracy or completeness of the information or opinions contained within this update by Spreadex Ltd or any of its employees and no liability is accepted by such persons for the accuracy or completeness of any such information or opinions. As such, no reliance may be placed for any purpose on the information and opinions contained within this update.
The information contained within this update is the intellectual property of Spreadex Ltd and is protected by UK and International copyright laws. All rights reserved. Users may however freely download, distribute and reproduce extracts of the contents, subject always to accrediting Spreadex Ltd as the source and providing a hyperlink to www.spreadex.com.


