Weekly Technical Analysis
Weekly Technical Analysis
Technical Analysis Weekly
Start your week by identifying the key price levels and trends.
The SpreadEx Research team has analysed the most popular markets, including stocks, indices, commodities & forex.
NOTE: These charts use the ‘Pro Trading Tools’ available on the SpreadEx trading platform. To use them, log in to your SpreadEx Financials Account and click ‘Technical’ from the menu on any chart.
WEEK COMMENCING 22ND JUNE 2026
Summary
Instrument |
Trend |
Phase |
Price |
VWAP |
Support |
Resistance |
RSI |
|---|---|---|---|---|---|---|---|
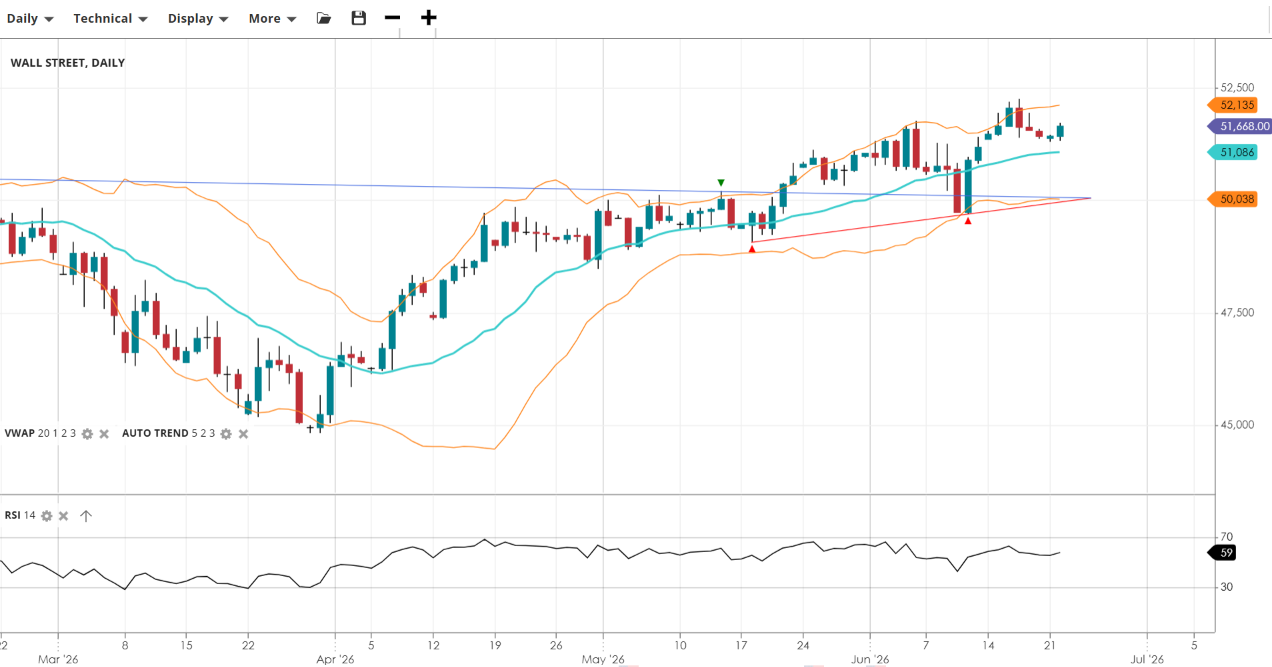
Wall Street |
Bullish |
Impulsive |
51,668 |
51,086 |
50,038 |
52,135 |
59 |
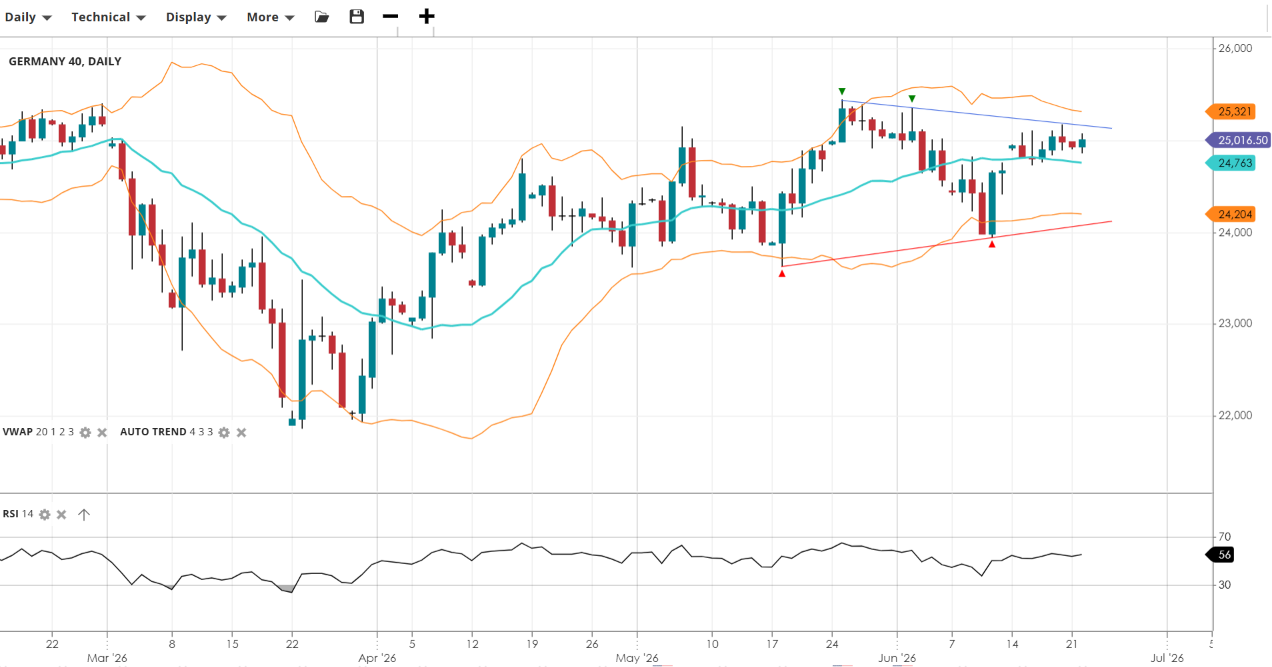
Germany 40 |
Bullish |
Correction |
25,017 |
24,763 |
24,204 |
25,321 |
56 |
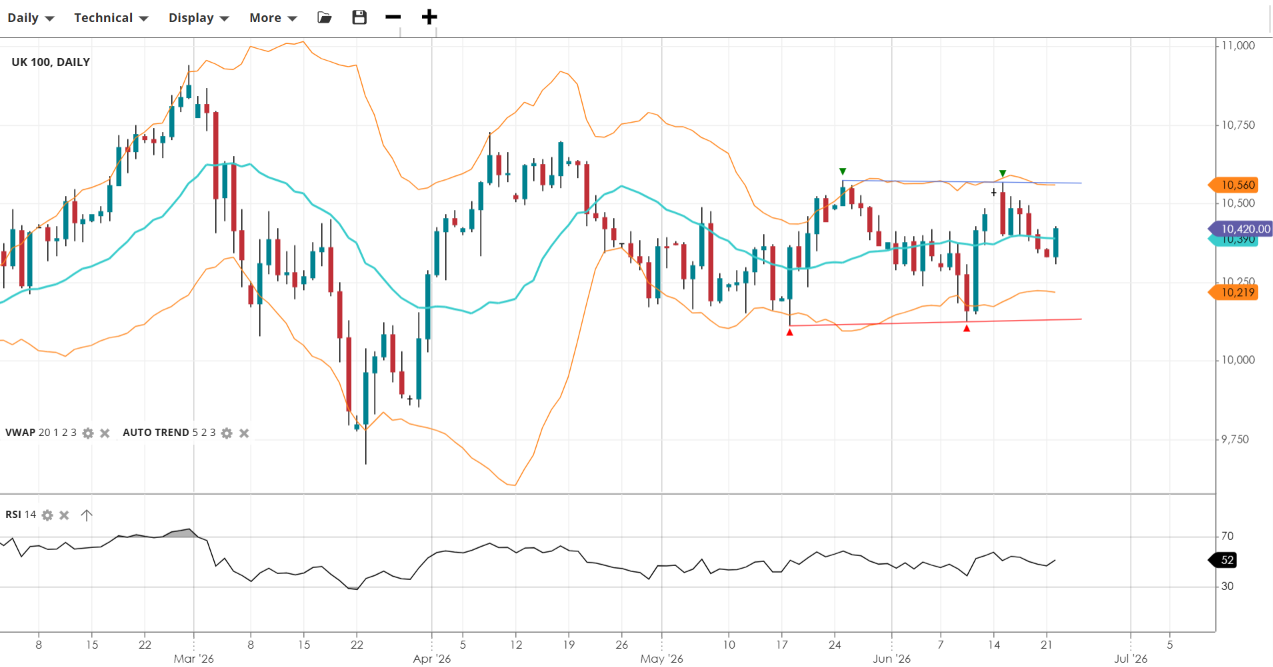
UK 100 |
Neutral |
Correction |
10,420 |
10,390 |
10,219 |
10,560 |
52 |
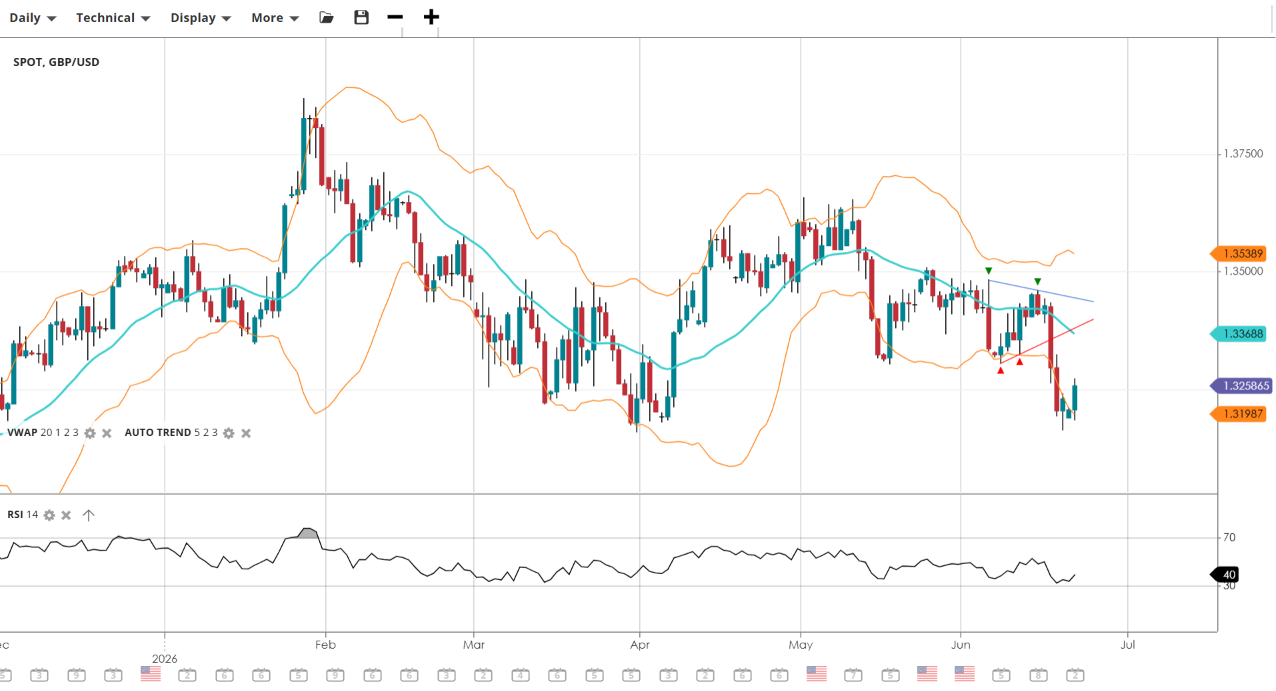
GBP/USD |
Bearish |
Impulsive |
1.3258 |
1.3368 |
1.3198 |
1.3539 |
40 |
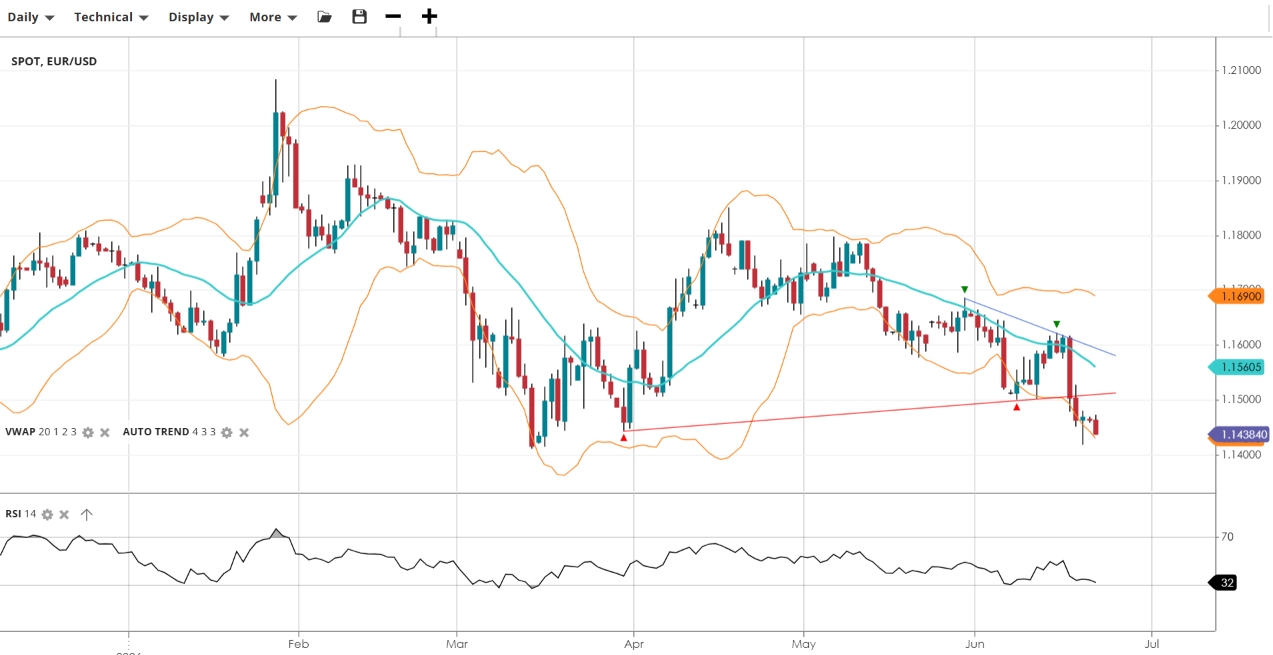
EUR/USD |
Bearish |
Impulsive |
1.1438 |
1.1560 |
1.1435 |
1.1690 |
32 |
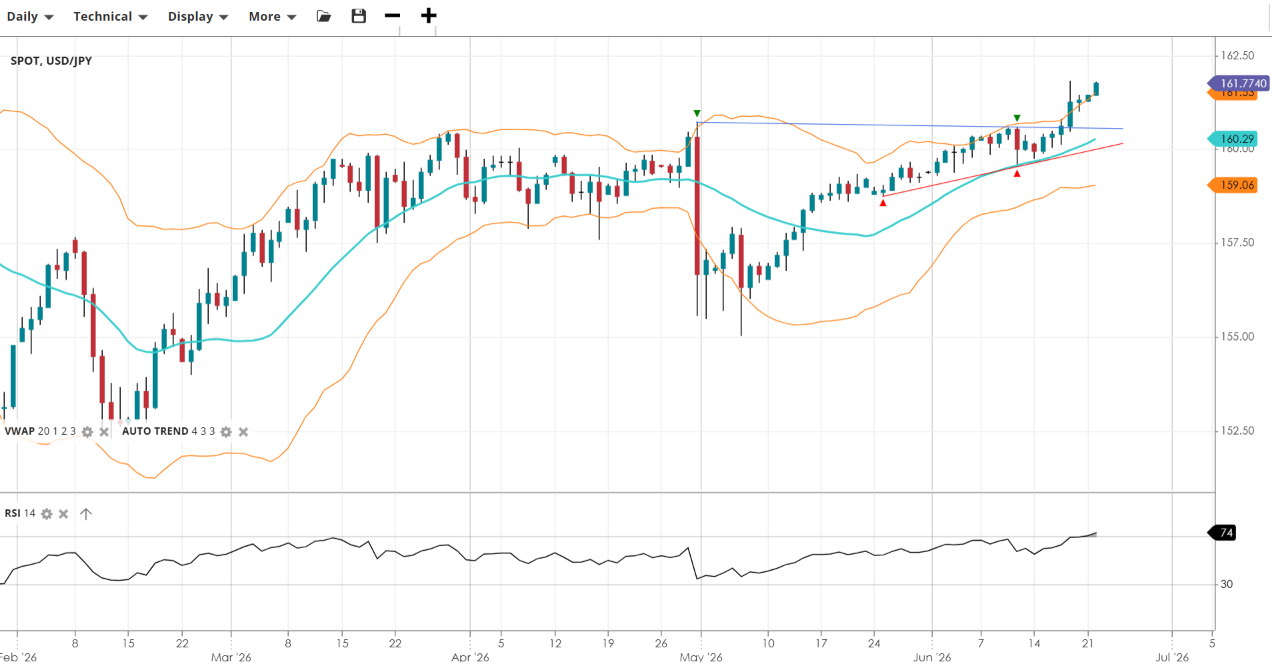
USD/JPY |
Bullish |
Breakout |
161.77 |
160.29 |
159.06 |
161.55 |
74 |
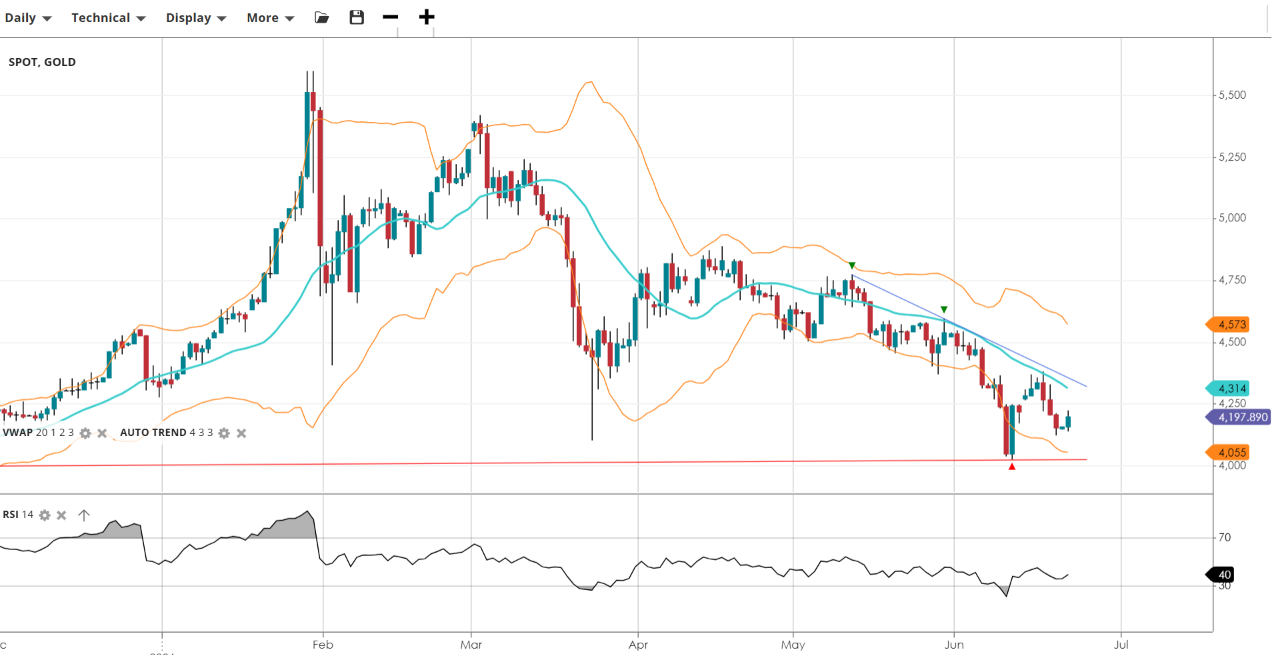
Gold |
Bearish |
Pullback |
4,198 |
4,314 |
4,055 |
4,573 |
40 |
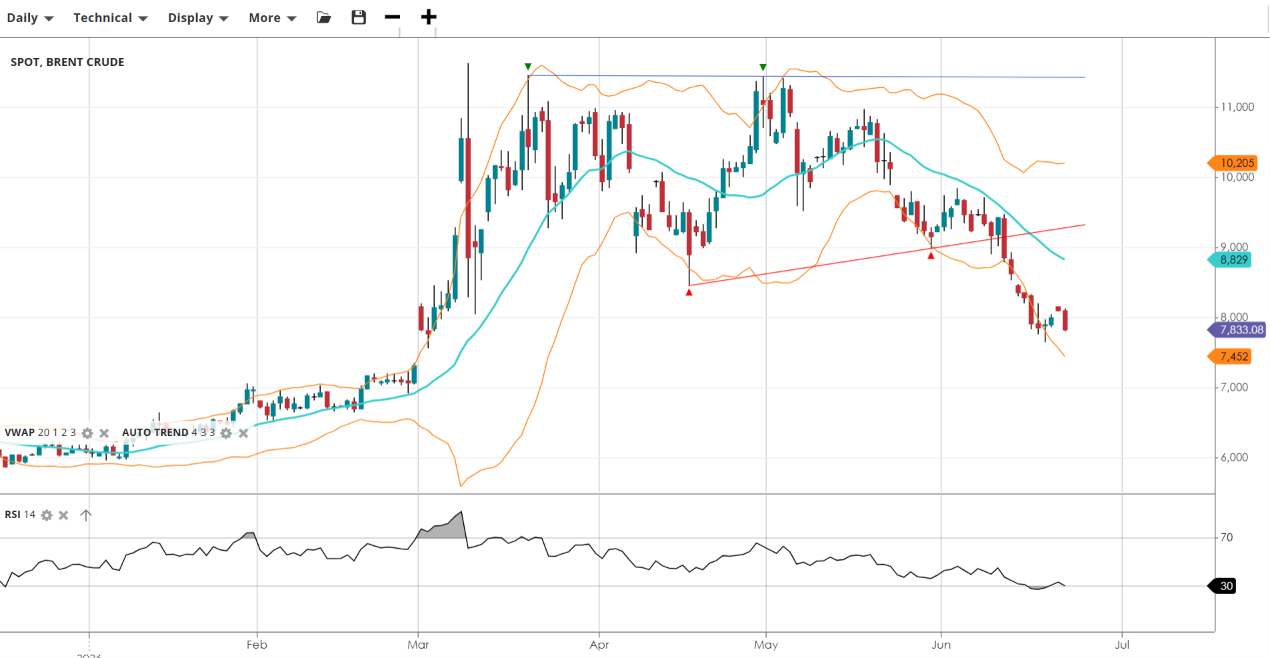
Brent Crude |
Bearish |
Impulsive |
7,833 |
8,829 |
7,452 |
10,205 |
30 |
*KEY*
- Price and 20-day VWAP at the time of writing.
- RSI level (70 is overbought and under 30 is oversold).
- Support & Resistance are set by the StdDev #2 Lower and Upper respectively.
- Trend is set by the slope of the VWAP over 50 periods.
- Phase is determined by the current price relative to the VWAP (20) level.
Analysis
Wall Street
Wall Street continues to hold its bullish structure, with price tracking above the VWAP while breaking to a fresh record high. The RSI at 59 reflects steady bullish momentum without yet approaching overbought territory. The trend remains constructive, and the bias stays higher while price maintains its footing above the rising trendline.
Germany 40
The Germany 40 is above the VWAP and is consolidating just below the descending trendline from recent highs. The RSI at 56 is mildly elevated but does not yet signal a clear directional impulse. The ascending support trendline from the April lows remains the key level to watch on the downside, and the overall bias is bullish but stays near term neutral until a decisive break in either direction.
UK 100
The UK 100 was edging below the VWAP but lept back over it on Monday. However, it is stalling just beneath the flat horizontal resistance that has capped advances in recent weeks. The RSI at 52 is neutral and offers little directional conviction. The near-term bias remains cautious while price trades between support and resistance; a sustained close above the horizontal level would be needed to reassert a bullish tone.
GBP/USD
GBP/USD has broken below the VWAP and is in an impulsive bearish phase, with price now probing the April lows. The RSI at 40 reflects building bearish momentum, though it remains above oversold territory. The bias is now to the downside while price holds below the VWAP, with 1.32 the primary target for bears.
EUR/USD
EUR/USD is back at its lowest levels since March after it extended its decline below the VWAP, with price continuing to press lower and the RSI at 32 approaching oversold territory. The descending trendline continues to cap any recovery attempts. A break of the 1.14 support level would open the way toward a fresh long term downtrend, while a bounce from here could attract some tactical buying.
USD/JPY
USD/JPY has broken above longstanding horizontal resistance near 161 and is pushing to fresh highs, with price now well above the VWAP and the RSI at 74 in overbought territory. The ascending support trendline from the May lows continues to underpin the move. The breakout above resistance is a significant bullish development, though the extended RSI reading warns that a short-term pause or pullback toward the VWAP may be due.
Gold
Gold remains in a corrective bearish phase, trading below the VWAP with the descending trendline providing a persistent cap on rallies. The RSI at 40 reflects continued negative momentum without yet reaching oversold levels. The key support level near the big $4K figure is the critical level to hold; a breach there would signal a more significant deterioration in the technical picture.
Brent Crude
Brent Crude is now in a sustained impulsive downtrend, with price trading far below the VWAP and the RSI at 30 on the cusp of oversold territory. Selling pressure has been persistent and the dominant directional bias remains firmly bearish. Any near-term bounce from the oversold extreme is likely to find the VWAP as a significant overhead barrier before the broader downtrend can be meaningfully challenged.
It's easy to open an account
- Fill in our simple online application form
- Fund your account
- Start trading the global markets instantly!
SEARCH FOR AN ARTICLE:
Enter a keyword and search for all relevant articlesMARKET ANALYSIS
RECENT POSTS
DISCLAIMER
Spread bets and CFDs are complex instruments and come with a high risk of losing money rapidly due to leverage. 61% of retail investors lose money when trading spread bets and CFDs with this provider. You should consider whether you understand how spread bets and CFDs work and whether you can afford to take the high risk of losing your money. For professional clients, spread betting and CFD trading can also result in losses larger than your initial stake or deposit.
Spreadex Ltd is authorised and regulated by the Financial Conduct Authority, provides an execution only service and does not provide advice in any way. Nothing within this update should be deemed to constitute the provision of investment advice, recommendations, any other professional advice in any way, or a record of our trading prices. This update does not constitute or form part of an offer of, or solicitation for a transaction in any financial instrument, nor shall it or the fact of its distribution form the basis of, or be relied on in connection with, any contract therefore. Any persons placing trades based on their interpretation of the comments or information within this update does so entirely at their own risk.
No representation, warranty, or undertaking, express or limited, is given as to the accuracy or completeness of the information or opinions contained within this update by Spreadex Ltd or any of its employees and no liability is accepted by such persons for the accuracy or completeness of any such information or opinions. As such, no reliance may be placed for any purpose on the information and opinions contained within this update.
The information contained within this update is the intellectual property of Spreadex Ltd and is protected by UK and International copyright laws. All rights reserved. Users may however freely download, distribute and reproduce extracts of the contents, subject always to accrediting Spreadex Ltd as the source and providing a hyperlink to www.spreadex.com.


