Weekly Technical Analysis
Weekly Technical Analysis
Technical Analysis Weekly
Start your week by identifying the key price levels and trends.
The SpreadEx Research team has analysed the most popular markets, including stocks, indices, commodities & forex.
NOTE: These charts use the ‘Pro Trading Tools’ available on the SpreadEx trading platform. To use them, log in to your SpreadEx Financials Account and click ‘Technical’ from the menu on any chart.
WEEK COMMENCING 27th OCTOBER 2025
Summary
Instrument |
Trend |
Phase |
Price |
VWAP |
Support |
Resistance |
RSI |
|---|---|---|---|---|---|---|---|
Germany 40 |
Neutral |
Range |
24266 |
24200 |
23882 |
24608 |
53.4 |
UK 100 |
Bullish |
Impulsive |
9639 |
9461 |
9279 |
9650 |
67.5 |
Wall Street |
Bullish |
Impulsive |
47477 |
46386 |
45357 |
47477 |
65.3 |
Brent Crude |
Bearish |
Correction |
6481 |
6354 |
5983 |
6724 |
52.7 |
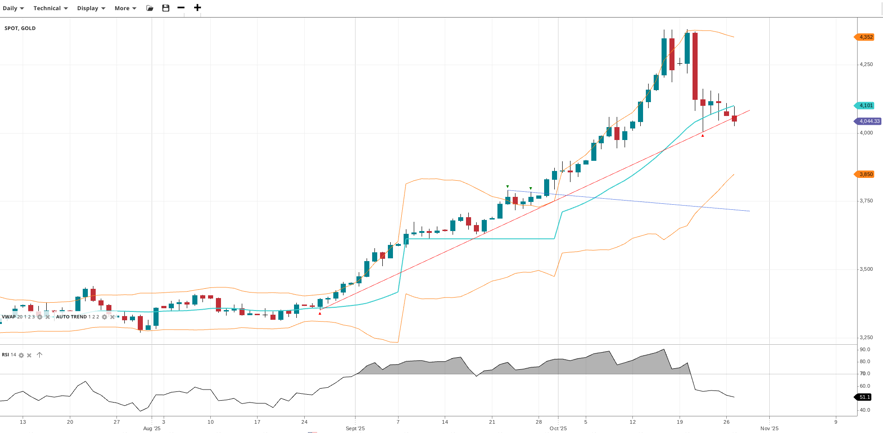
Gold |
Bullish |
Correction |
4044 |
4101 |
3850 |
4352 |
51.1 |
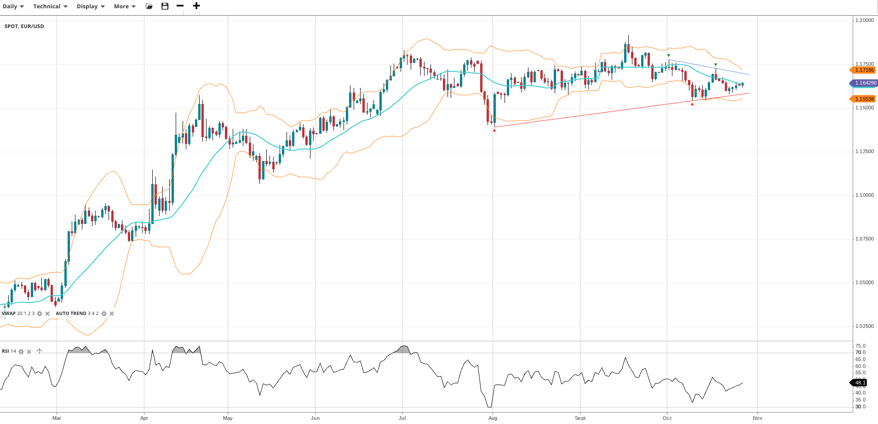
EUR/USD |
Neutral |
Range |
1.1643 |
1.1640 |
1.1554 |
1.1719 |
48.1 |
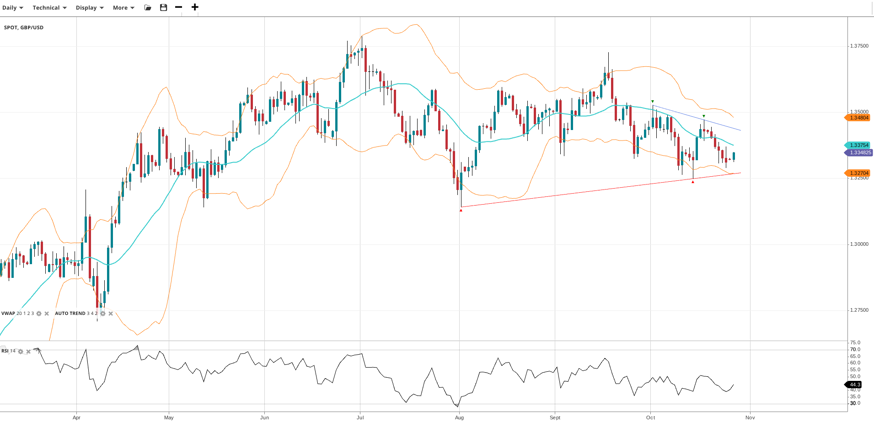
GBP/USD |
Neutral |
Range |
1.3348 |
1.3375 |
1.3270 |
1.3480 |
44.3 |
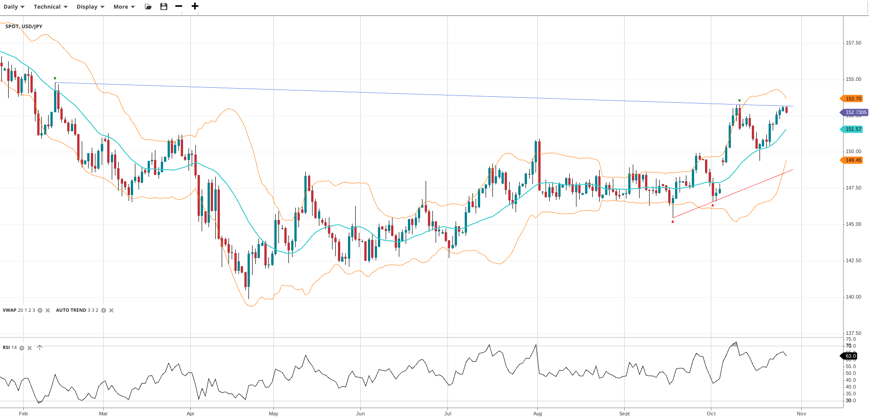
USD/JPY |
Bullish |
Impulsive |
152.73 |
151.57 |
149.45 |
153.70 |
63.0 |
*KEY*
- Trend is set by the slope of the VWAP over 50 periods.
- Phase is determined by the current price relative to the VWAP (20) level.
- Price at the time of writing.
- Support & Resistance are set by the StdDev #2 Lower and Upper respectively.
- RSI level (70 is overbought and under 30 is oversold).
Analysis
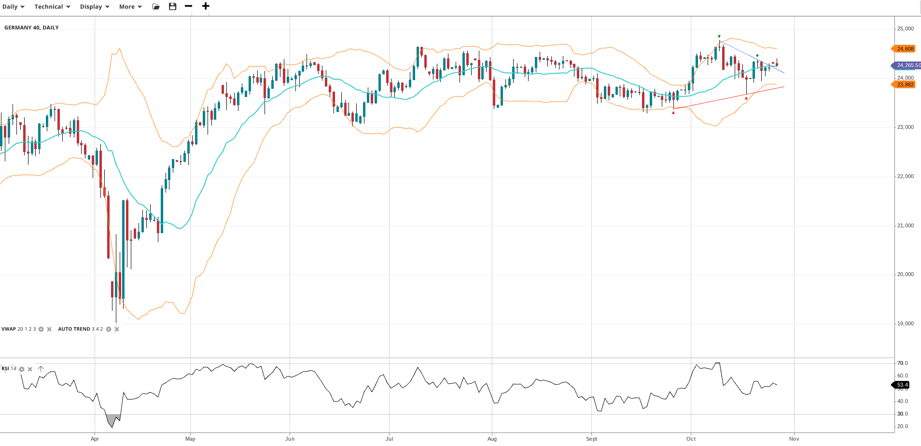
Germany 40 remains rangebound, trading at 24,266, slightly above its VWAP of 24,200. The RSI at 53.4 shows stable momentum. Support is at 23,882, while resistance stands at 24,608.
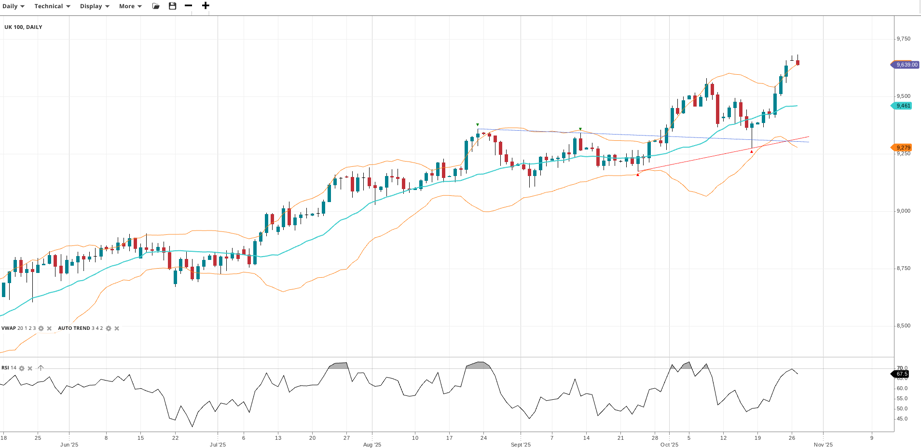
The UK 100 has hit a new record high, in a new impulsive phase of its bull trend. It trades at 9,639, clearly above the VWAP at 9,461, suggesting strong upward momentum. RSI is elevated at 67.5, indicating strong bullish sentiment. Support is at 9,279, with resistance matching the recent high.
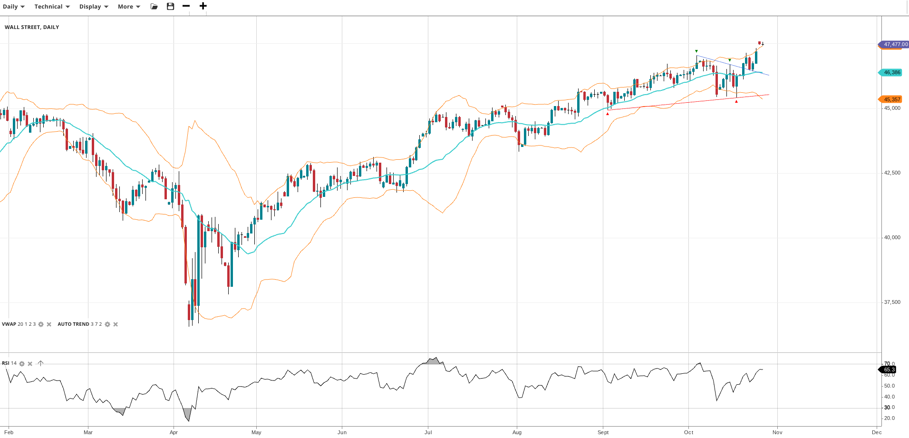
Wall Street continues its bullish trend and has resumed an impulsive phase, trading at 47,477 above the VWAP of 46,386. The RSI at 65.3 confirms good upward momentum. Support lies at 45,357, with resistance forming at the new high of 47,477.
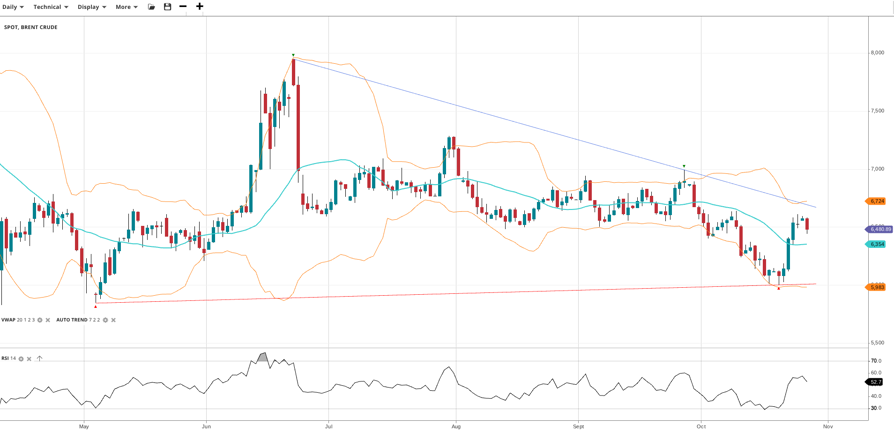
Brent Crude is in a bearish trend but a 2-day surge has taken it into a correction. Trading at 6,481, it sits above the VWAP at 6,354, hinting at potential recovery. The RSI at 52.7 supports a balanced market outlook. Support is seen at 5,983, while resistance stands at 6,724.
Gold has shifted into a correction phase following its long bullish trend, trading at 4,044 just under the VWAP of 4,101. The RSI of 51.1 reflects neutral momentum. Support is a good amount lower at 3,850, with resistance back at the highs at 4,352.
EUR/USD is still stuck in its trading range. It trades at 1.1643, right around the VWAP. The RSI at 48.1 shows a lack of strong conviction in either direction. Support is at 1.1554 and resistance is also at the VWAP level of 1.1719.
GBP/USD continues with a slight bearish bias within its sideways range, trading at 1.3348under its VWAP of 1.3375. RSI at 44.3 reflects limited bullish pressure. Support is at 1.3270, while resistance stands at 1.3480.
USD/JPY sustains its bullish trend with a retest of the prior multi-month high, trading at 152.73, above the VWAP of 151.57. The RSI of 63.0 reinforces the strong upward momentum. Support lies at 149.45, while resistance is at 153.70.
It's easy to open an account
- Fill in our simple online application form
- Fund your account
- Start trading the global markets instantly!
SEARCH FOR AN ARTICLE:
Enter a keyword and search for all relevant articlesMARKET ANALYSIS
RECENT POSTS
DISCLAIMER
Spread bets and CFDs are complex instruments and come with a high risk of losing money rapidly due to leverage. 61% of retail investors lose money when trading spread bets and CFDs with this provider. You should consider whether you understand how spread bets and CFDs work and whether you can afford to take the high risk of losing your money. For professional clients, spread betting and CFD trading can also result in losses larger than your initial stake or deposit.
Spreadex Ltd is authorised and regulated by the Financial Conduct Authority, provides an execution only service and does not provide advice in any way. Nothing within this update should be deemed to constitute the provision of investment advice, recommendations, any other professional advice in any way, or a record of our trading prices. This update does not constitute or form part of an offer of, or solicitation for a transaction in any financial instrument, nor shall it or the fact of its distribution form the basis of, or be relied on in connection with, any contract therefore. Any persons placing trades based on their interpretation of the comments or information within this update does so entirely at their own risk.
No representation, warranty, or undertaking, express or limited, is given as to the accuracy or completeness of the information or opinions contained within this update by Spreadex Ltd or any of its employees and no liability is accepted by such persons for the accuracy or completeness of any such information or opinions. As such, no reliance may be placed for any purpose on the information and opinions contained within this update.
The information contained within this update is the intellectual property of Spreadex Ltd and is protected by UK and International copyright laws. All rights reserved. Users may however freely download, distribute and reproduce extracts of the contents, subject always to accrediting Spreadex Ltd as the source and providing a hyperlink to www.spreadex.com.


