Weekly Technical Analysis
Weekly Technical Analysis
Technical Analysis Weekly
Start your week by identifying the key price levels and trends.
This week's technical overview covers eight key markets: Wall Street, Germany 40, UK 100, GBP/USD, EUR/USD, USD/JPY, Gold and Brent Crude, highlighting the prevailing trend, market phase, and the key support and resistance levels traders should have on their radar.
NOTE: These charts use the ‘Pro Trading Tools’ available on the SpreadEx trading platform. To use them, log in to your SpreadEx Financials Account and click ‘Technical’ from the menu on any chart.
WEEK COMMENCING 14TH SEPTEMBER 2026
Summary
|
|
|
|
|
|
|
|
|---|---|---|---|---|---|---|---|
|
|
|
|
|
|
|
|
|
|
|
|
|
|
|
|
|
|
|
|
|
|
|
|
|
|
|
|
|
|
|
|
|
|
|
|
|
|
|
|
|
|
|
|
|
|
|
|
|
|
|
|
|
|
|
|
|
|
|
|
|
|
|
|
KEY
Trend: The prevailing directional bias of the market — Bullish or Bearish.
Phase: Whether price action is Impulsive (a strong, directional move) or Corrective (a retracement/consolidation against the prevailing trend).
Price: The latest available spot price at time of writing.
VWAP: Volume Weighted Average Price — a dynamic benchmark showing the average price paid, weighted by volume.
Support: A key price level below the market where buying interest has historically emerged.
Resistance: A key price level above the market where selling interest has historically emerged.
RSI: Relative Strength Index — a momentum oscillator; readings above 70 suggest overbought conditions, below 30 suggest oversold conditions.
Analysis
Wall Street
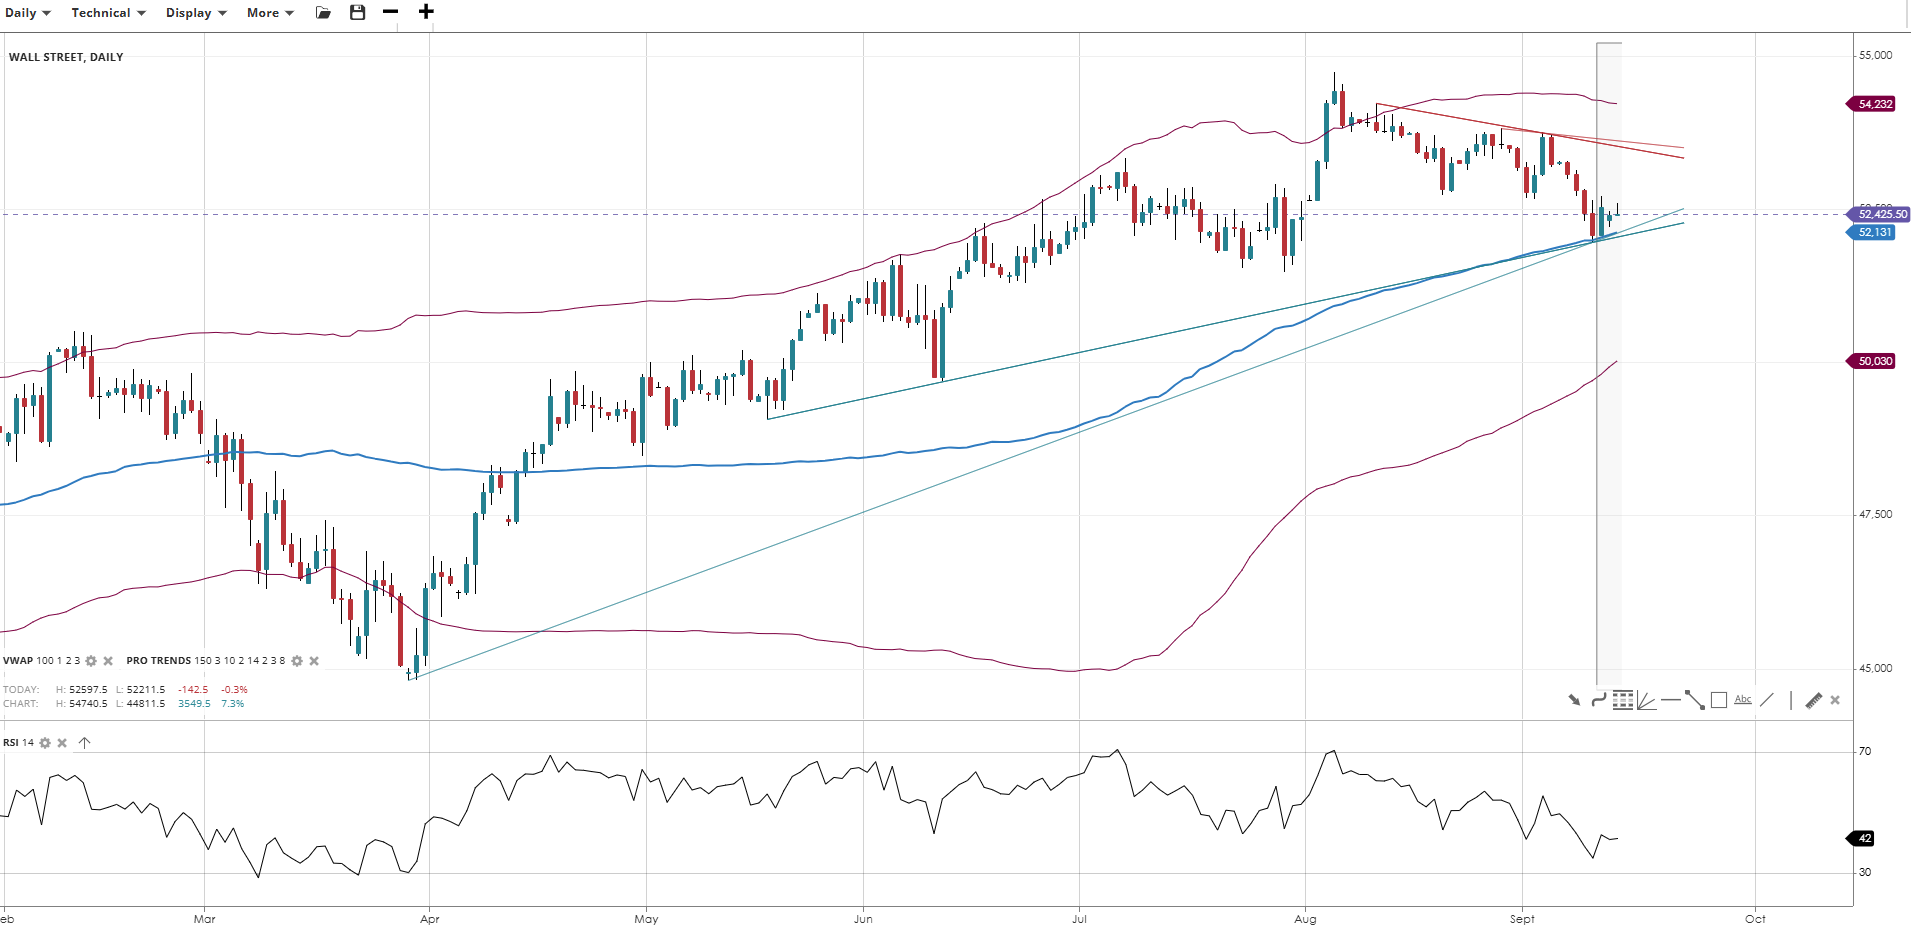
Wall Street's pullback from August's highs near 55,000 has deepened, with price now testing the 100-day SMA while the descending trendline from that high continues to cap rallies overhead. The longer-running rising trendline underneath still underpins the broader uptrend, and RSI's slide into the low-40s reflects further cooling rather than a reversal. Holding the SMA and rising trendline together would keep the bullish structure intact, while a break of both would risk a slide toward the lower band.
Germany 40
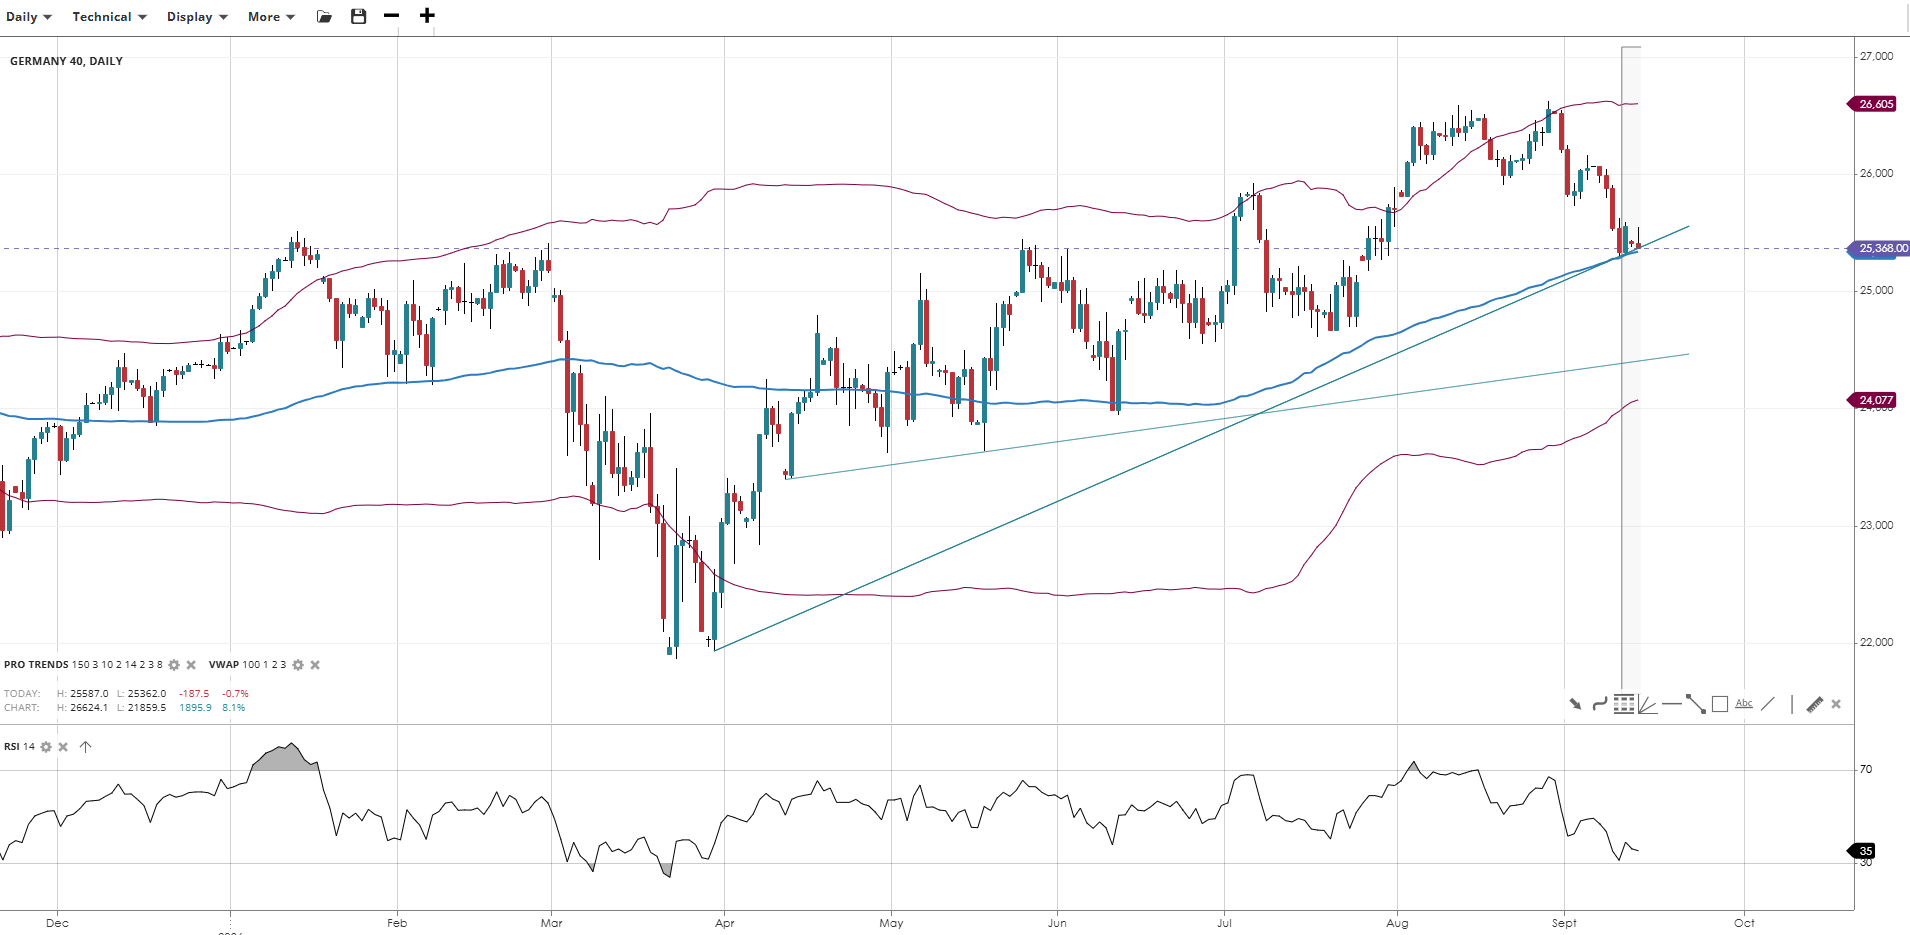
Germany 40's pullback has extended, with price sitting right on the 100-day SMA after failing to hold the push above 26,500. The index remains above its rising trendline, keeping the broader uptrend technically intact, though RSI's slip into the mid-30s points to a more pronounced loss of momentum than in recent weeks. A bounce off the SMA and trendline would restore bullish momentum, while a clean break below would open the door to a deeper correction.
UK 100
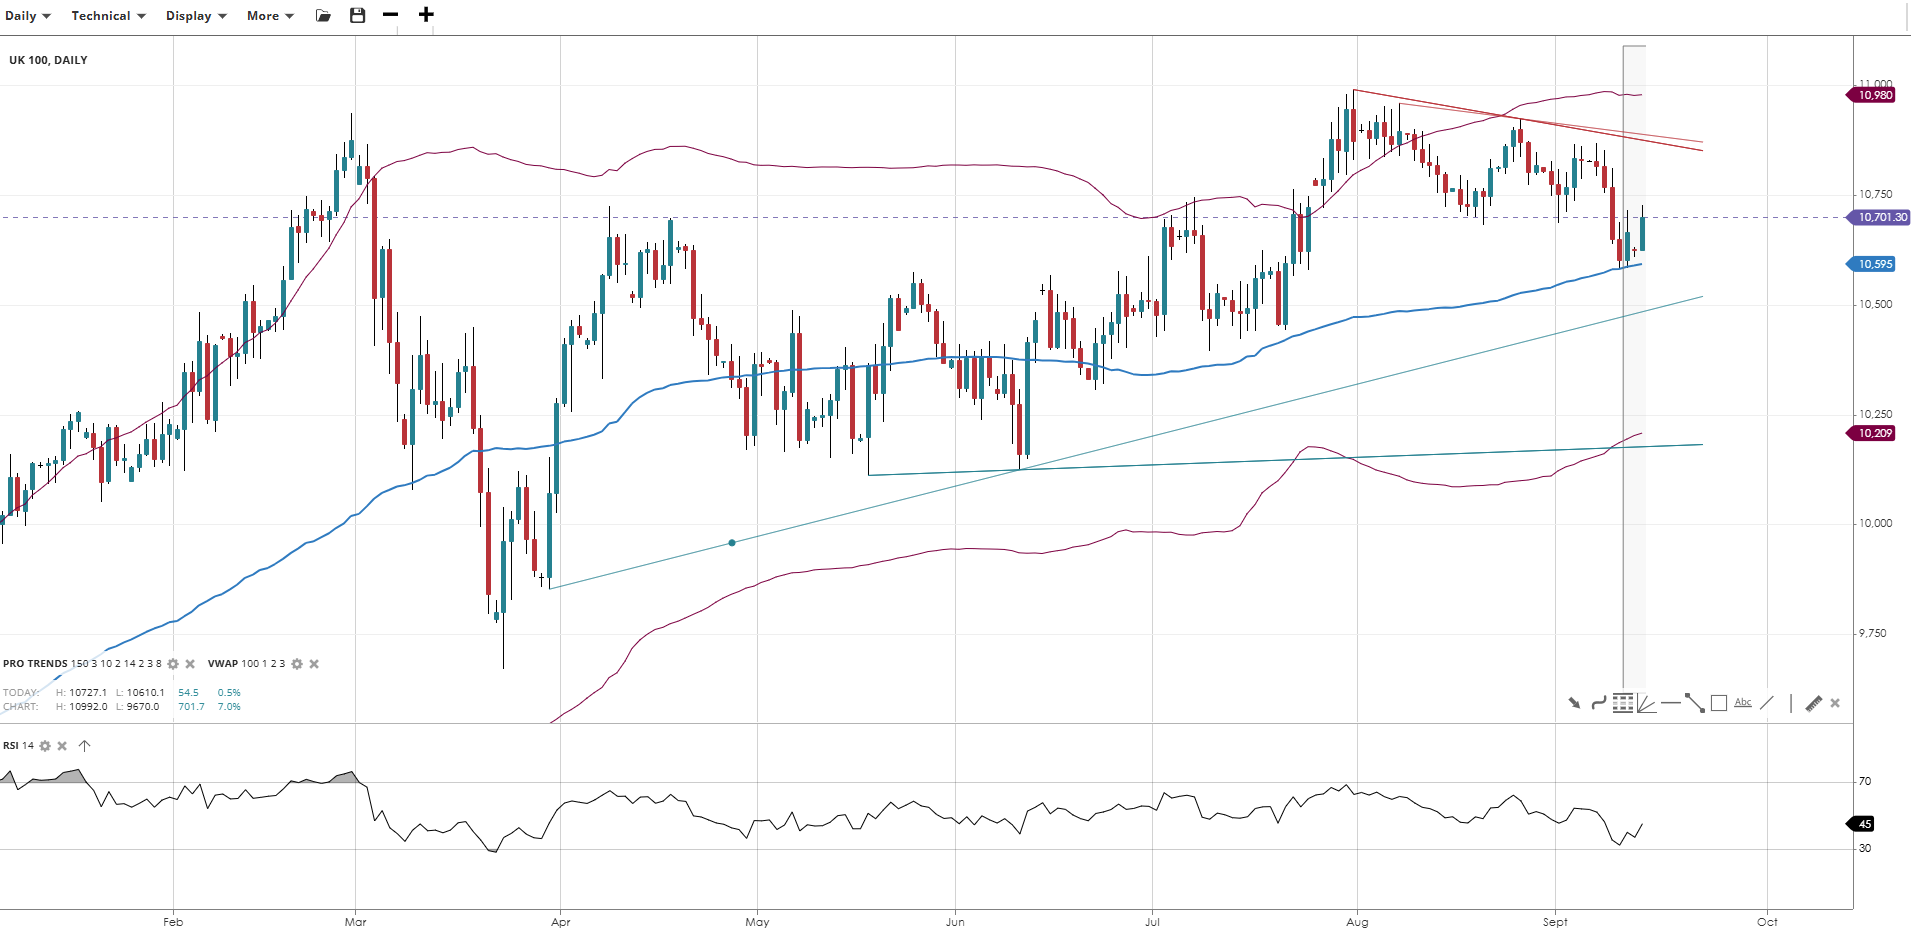
UK 100 is consolidating just below its recent high, with price holding modestly above the 100-day SMA as the index digests its August rally. A descending short-term trendline is capping the advance for now, but the broader gradual uptrend remains intact with RSI sitting around neutral. A break above trendline resistance would reopen the path to fresh highs, while a slip back below the SMA would flag a deeper pullback toward support.
GBP/USD
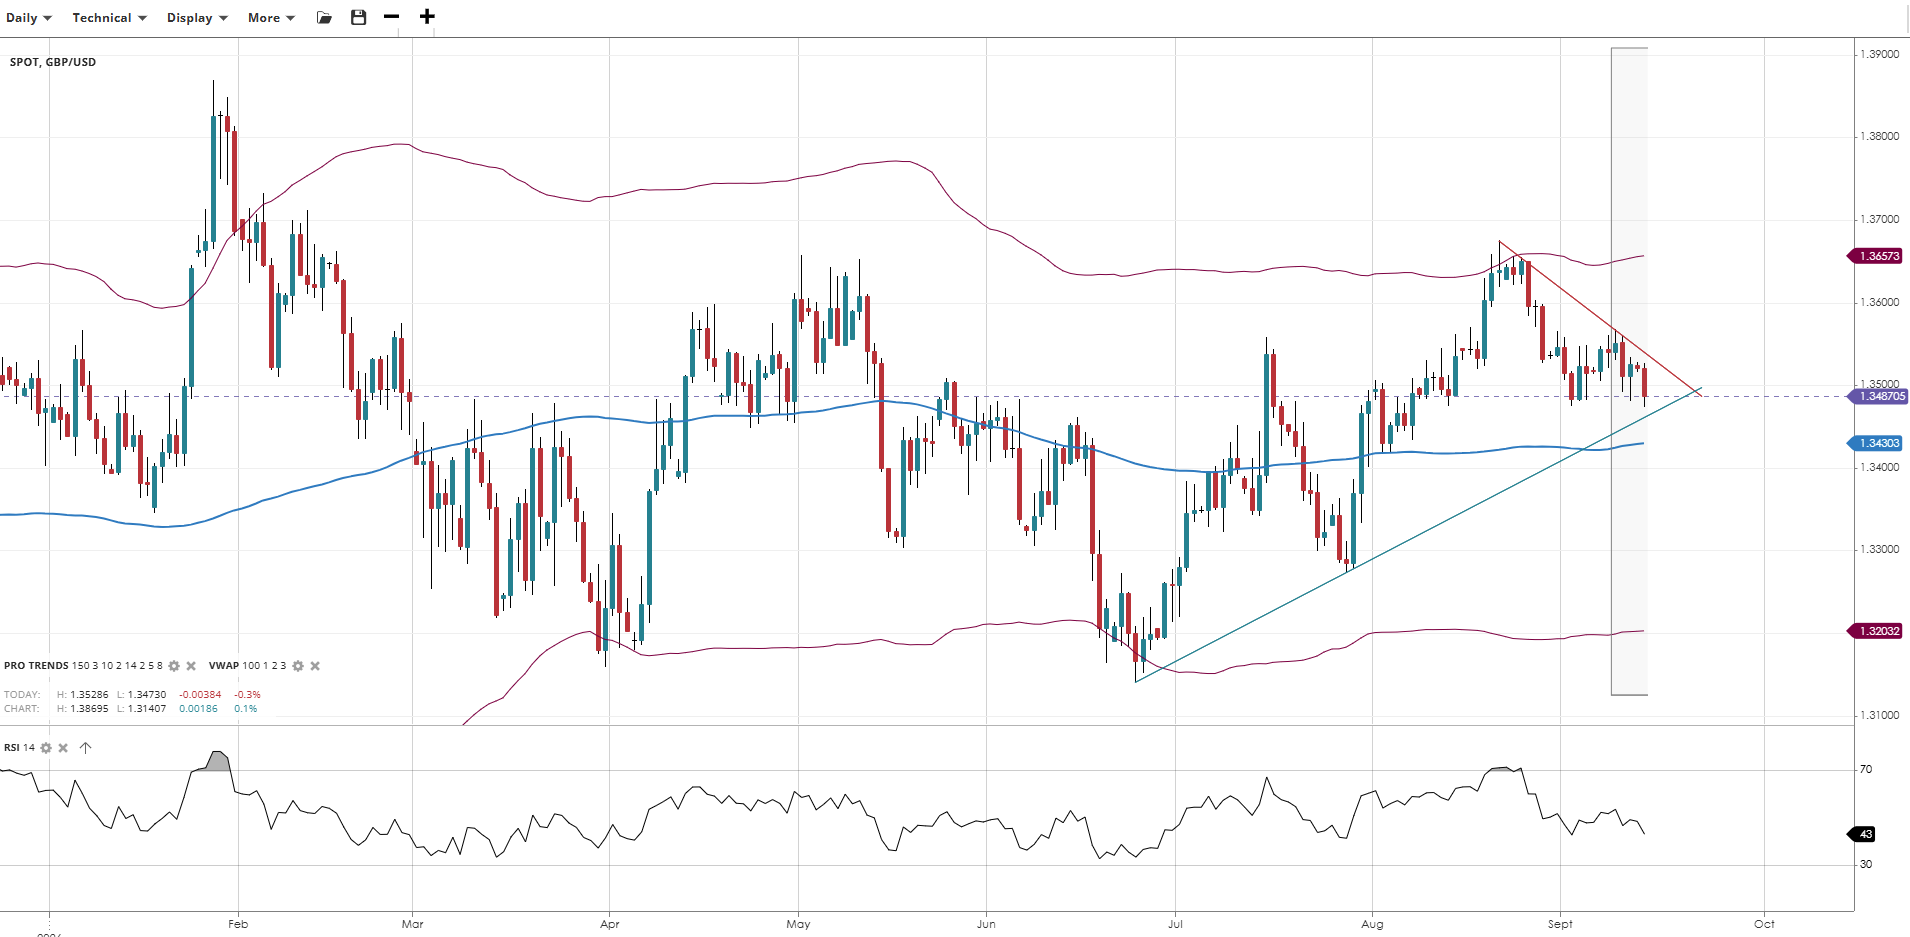
Cable continues to consolidate inside its narrowing wedge, with price easing back to trade just above the 100-day SMA in a shallow pullback. The rising trendline underneath keeps the near term bullish structure intact, while the descending trendline capping the wedge from above still needs to give way before fresh highs are in view, and RSI's return to the low-40s reflects fading upside momentum rather than a reversal. A break of trendline support would risk a deeper slide toward support.
EUR/USD
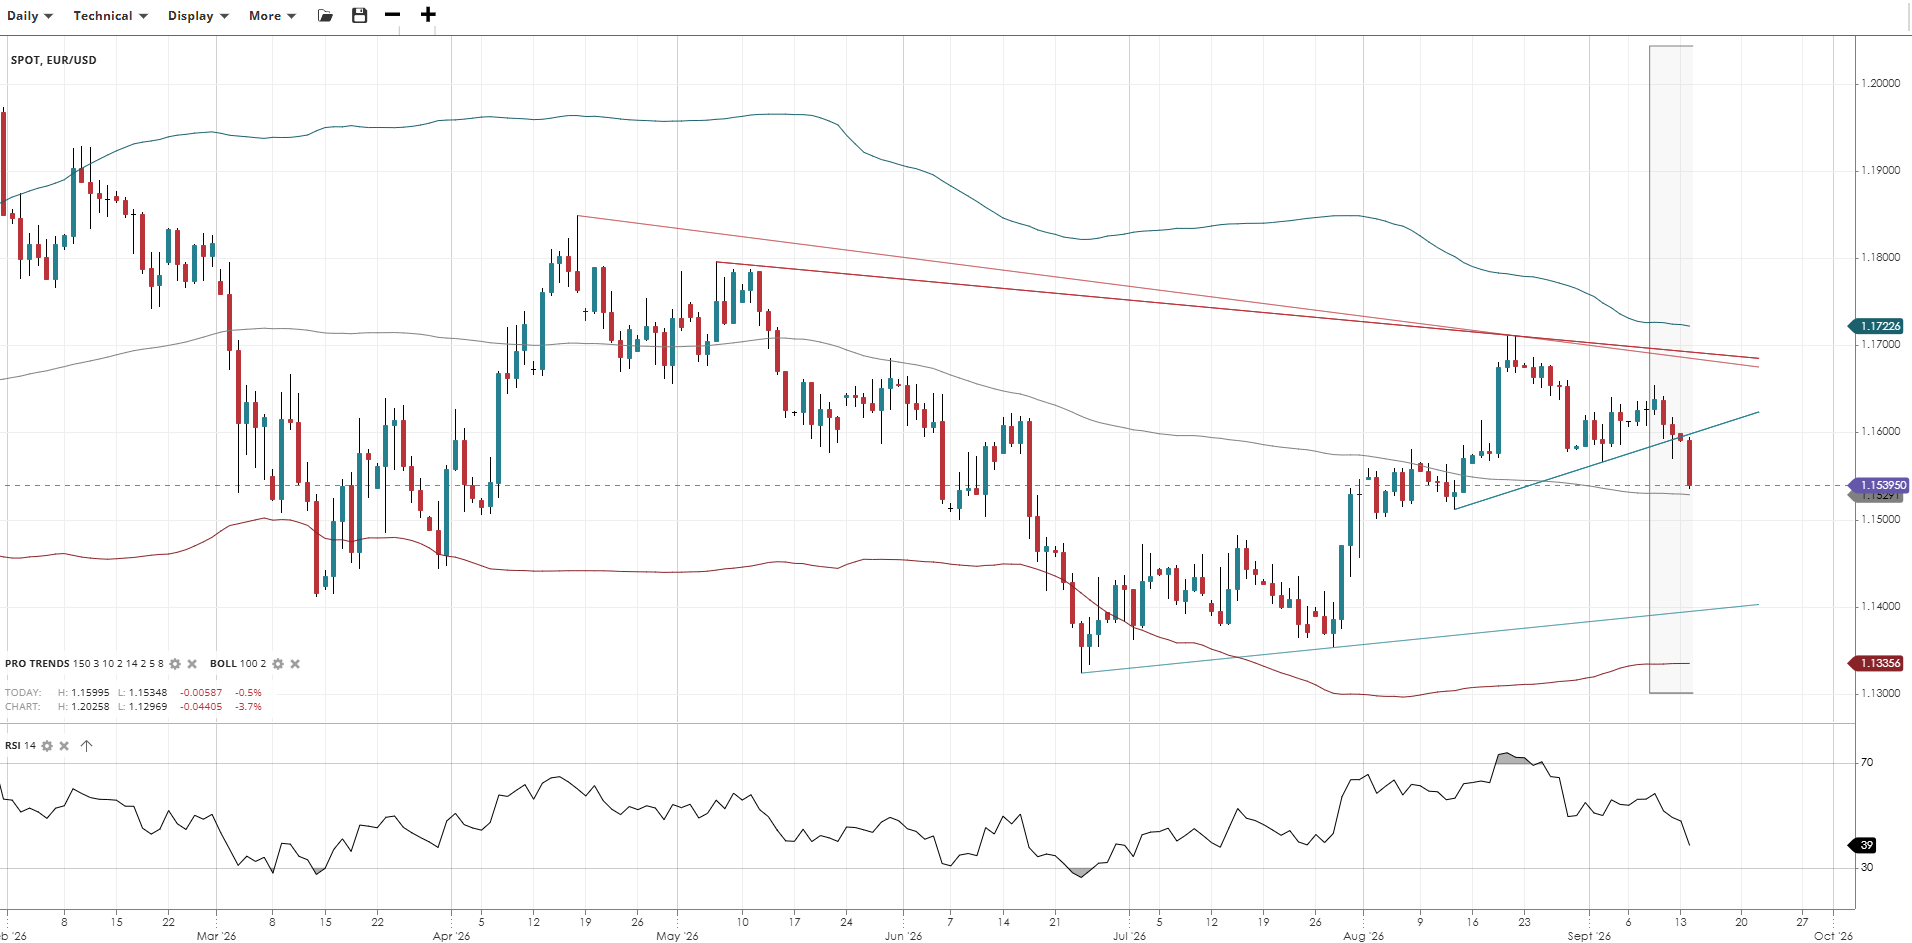
EUR/USD has turned decisively lower, breaking down through its short-term rising trendline to the 100 day SMA, while the longer descending trendline overhead continues to cap the broader multi-month decline. The pair's failure to hold August's bounce, together with RSI slipping into the high-30s, points to sellers regaining control rather than a continuation of the recent range. A reclaim of the broken trendline would be needed to stabilise the pair, while a fresh push below the 100 SMA would confirm the downside break.
USD/JPY
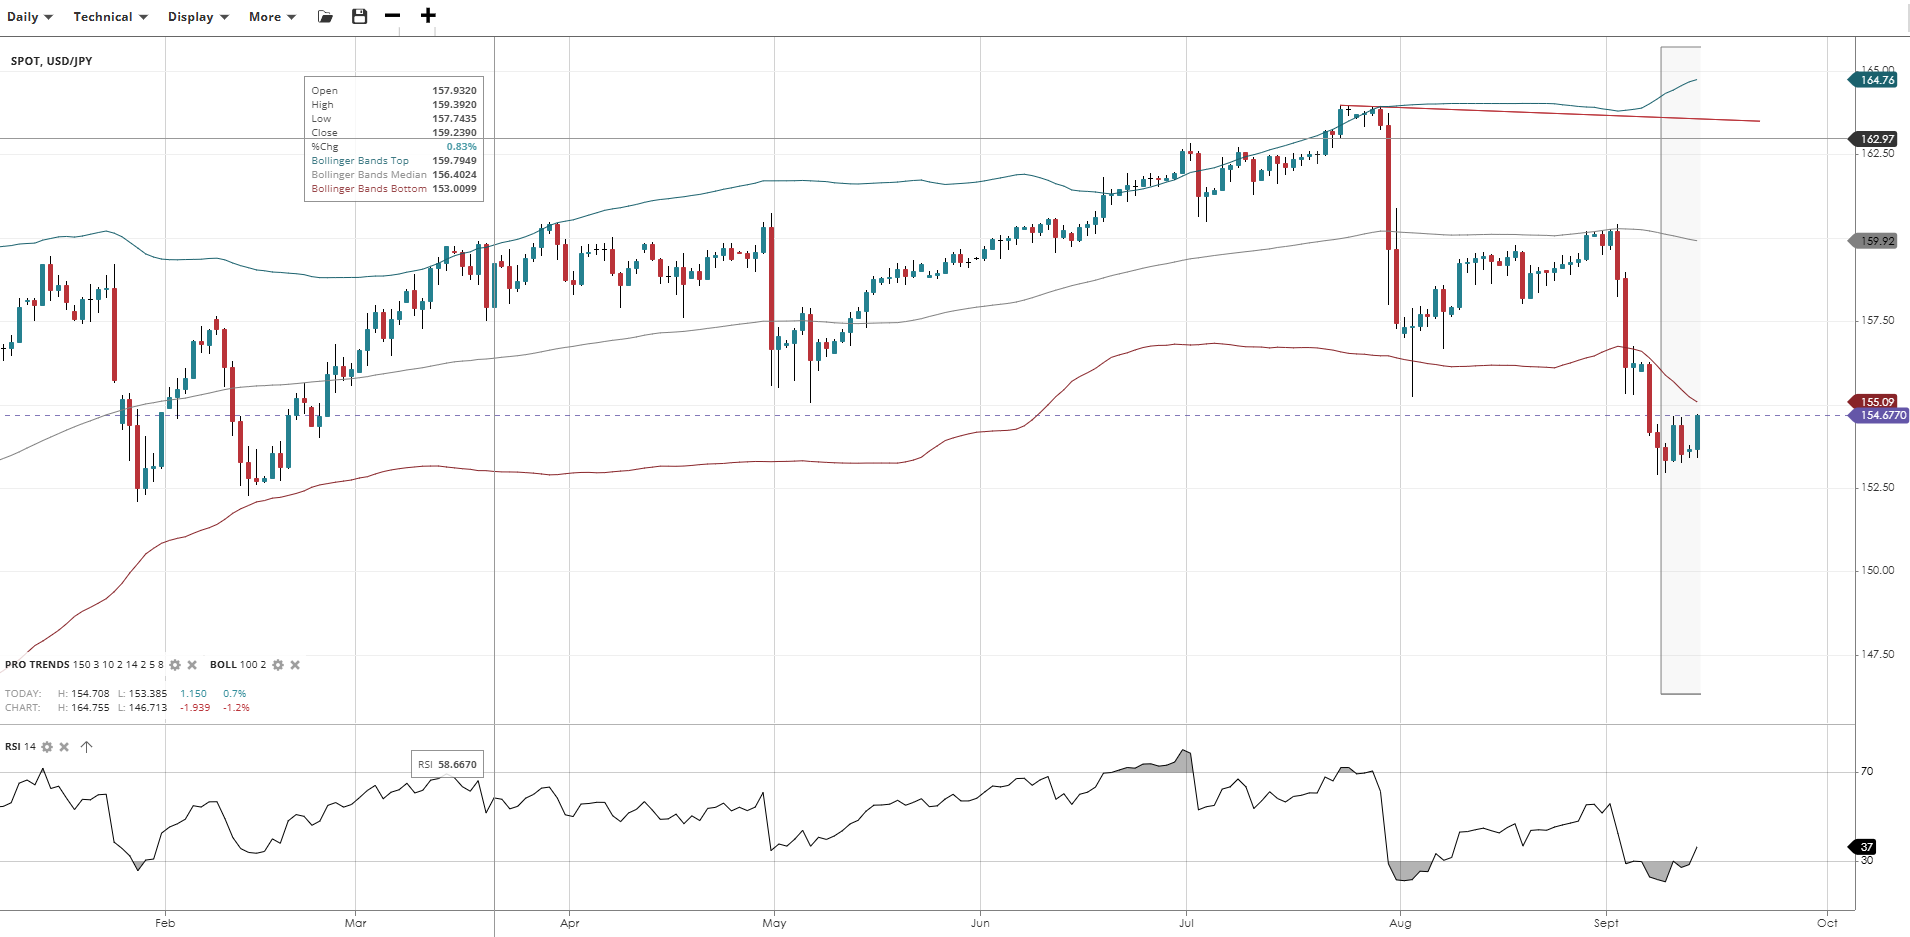
USD/JPY remains under pressure, still below its lower band despite several days of consolidation as the week prior's sharp breakdown continues to play out. Price sits well below the 100-day SMA, and RSI in the high-30s shows momentum still tilted lower even after the earlier plunge into oversold territory. Further downside is favoured while price holds below the lower band support, with a reclaim of the SMA needed to meaningfully challenge the bearish structure.
Gold
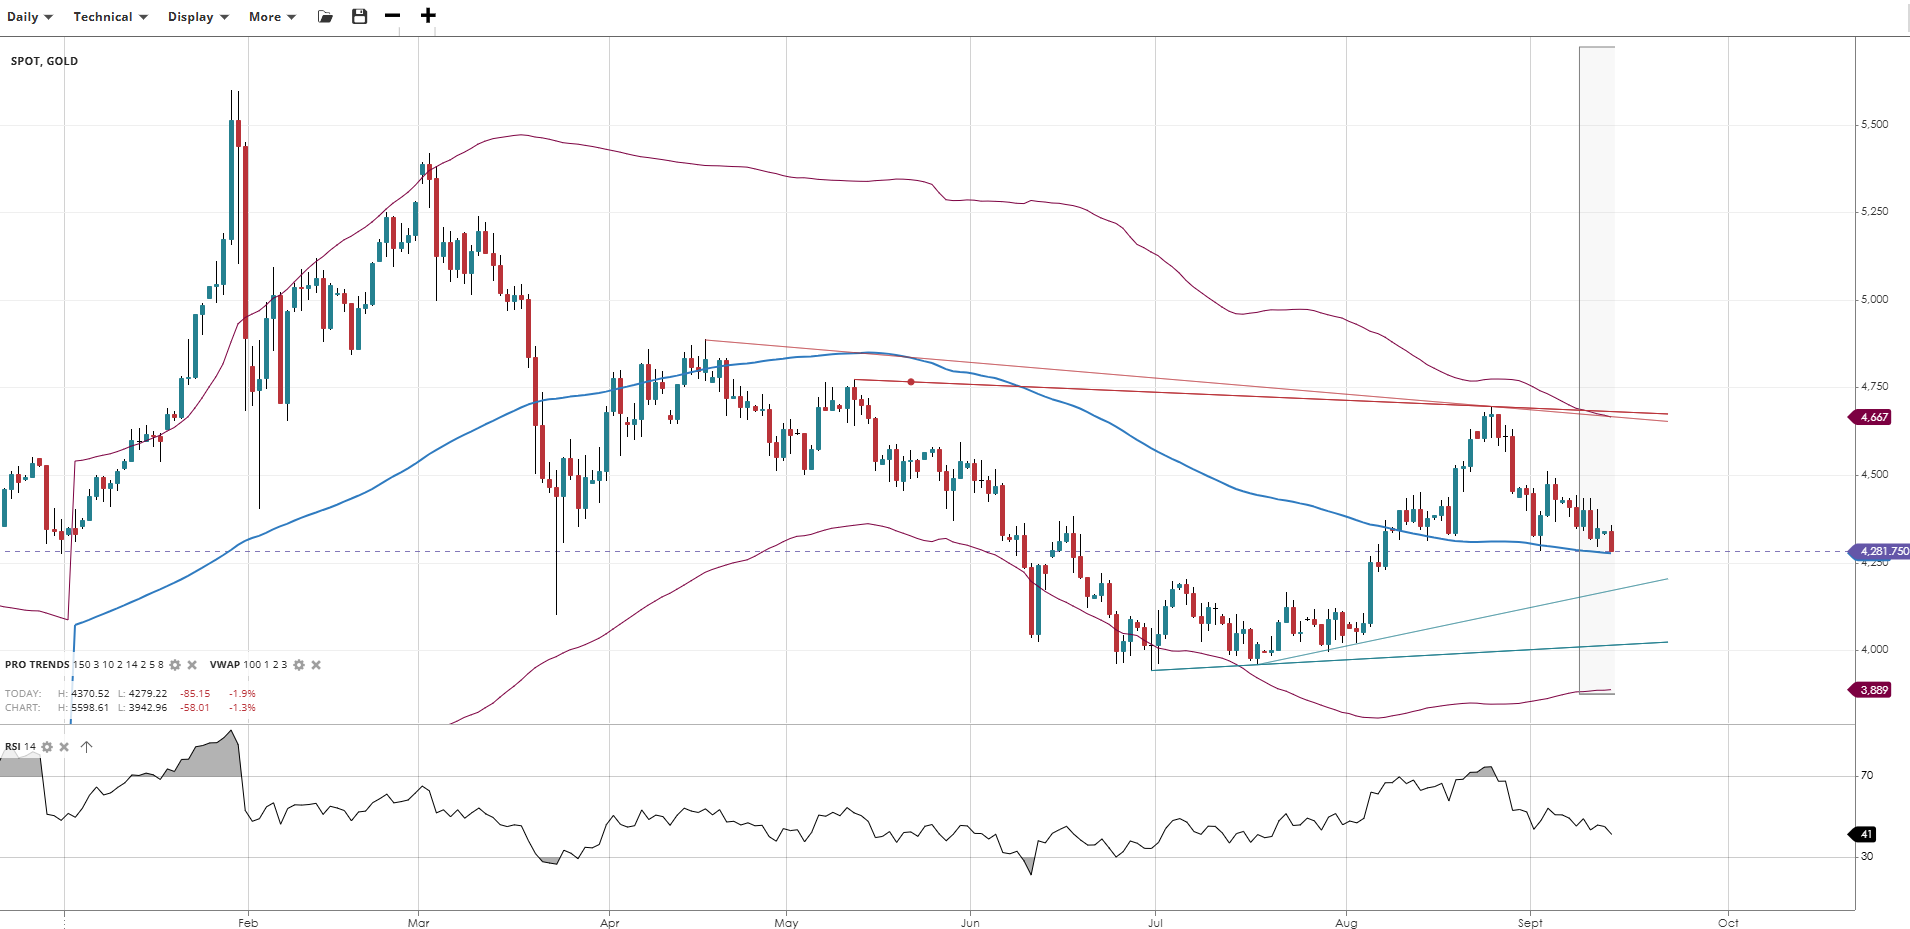
Gold has pulled back toward its 100-day SMA in an attempted break of the H&S neckline we mentioned in our daily report last week. The descending trendline above continues to cap the topside, giving back a portion of its September recovery. RSI's retreat to around 40 reflects a downwards shift momentum with room to spare until its oversold. A break above the descending trendline would reopen the path higher, while a clean break of the SMA risks a deeper correction toward support.
Brent Crude
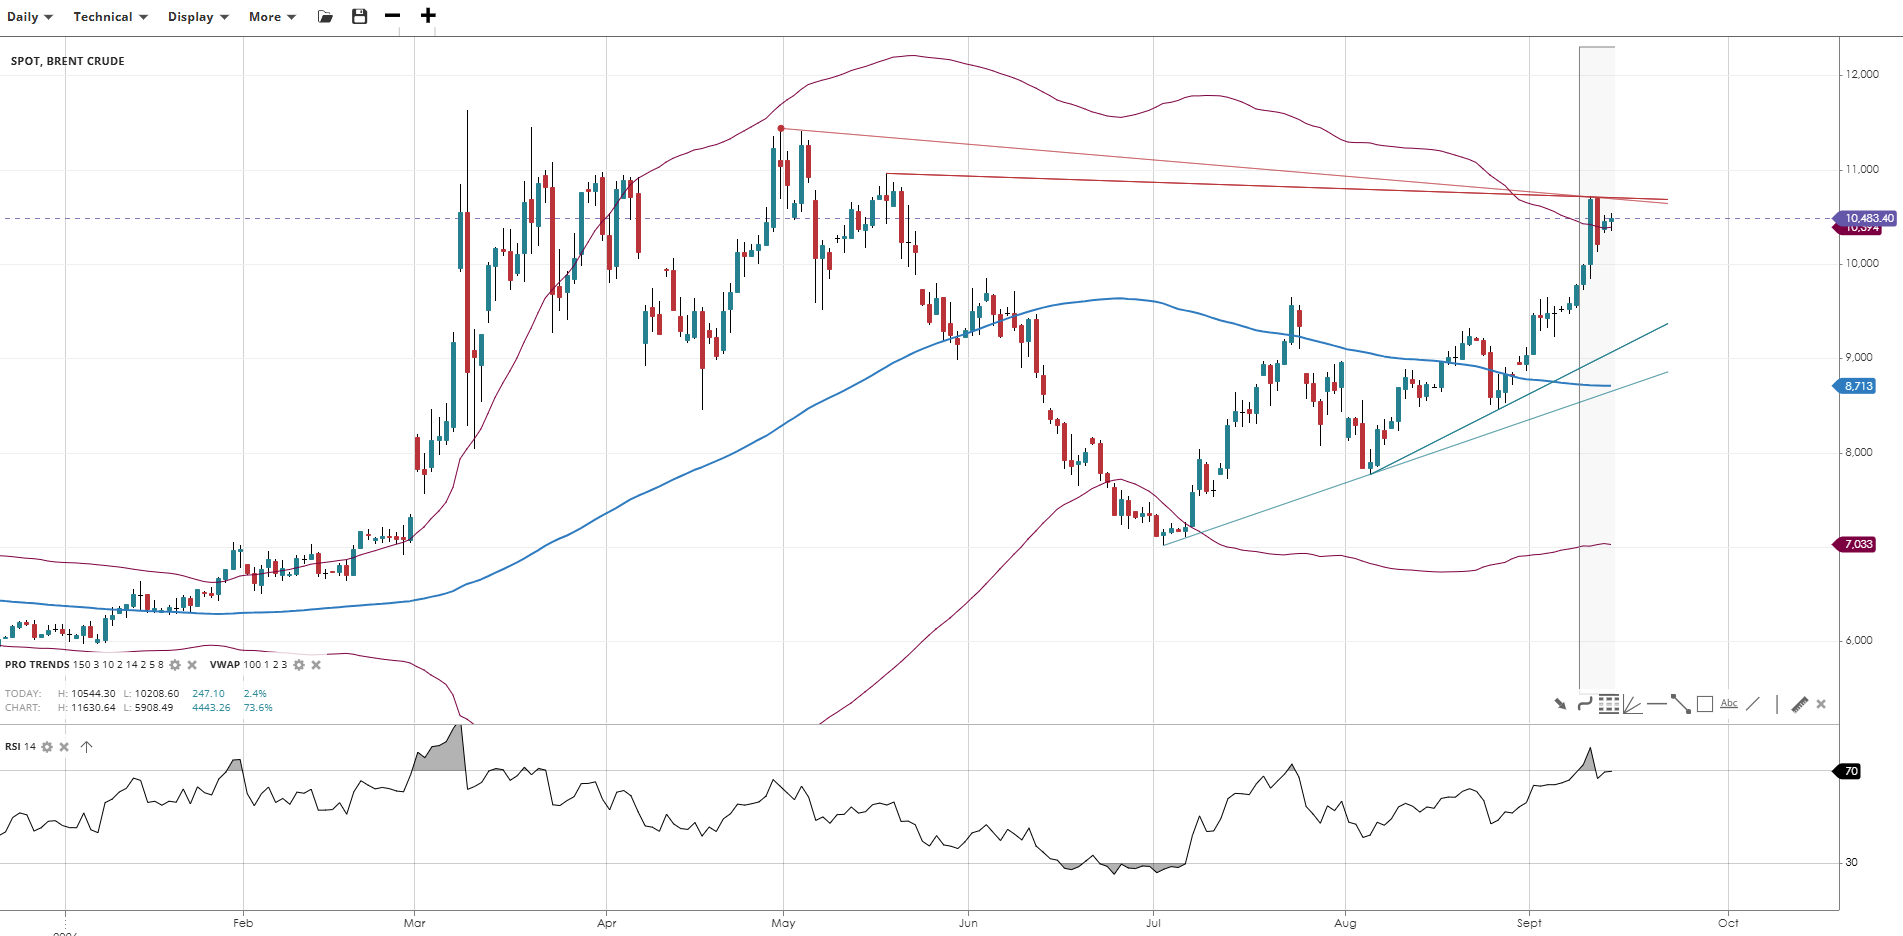
Brent Crude has broken out above both its upper band, extending its impulsive advance in strong fashion. RSI's push to around 70 underlines the strength of the move, though it also raises the risk of a near-term pause- already reflected in the dark cloud cover candle pattern. The longer rising trendline is now sitting well beneath as a distant support. A close back below the SMA would be needed to really suspect this leg is losing steam, while holding above the band favours further gains.
It's easy to open an account
- Fill in our simple online application form
- Fund your account
- Start trading the global markets instantly!
SEARCH FOR AN ARTICLE:
Enter a keyword and search for all relevant articlesMARKET ANALYSIS
RECENT POSTS
DISCLAIMER
Spread bets and CFDs are complex instruments and come with a high risk of losing money rapidly due to leverage. 61% of retail investors lose money when trading spread bets and CFDs with this provider. You should consider whether you understand how spread bets and CFDs work and whether you can afford to take the high risk of losing your money. For professional clients, spread betting and CFD trading can also result in losses larger than your initial stake or deposit.
Spreadex Ltd is authorised and regulated by the Financial Conduct Authority, provides an execution only service and does not provide advice in any way. Nothing within this update should be deemed to constitute the provision of investment advice, recommendations, any other professional advice in any way, or a record of our trading prices. This update does not constitute or form part of an offer of, or solicitation for a transaction in any financial instrument, nor shall it or the fact of its distribution form the basis of, or be relied on in connection with, any contract therefore. Any persons placing trades based on their interpretation of the comments or information within this update does so entirely at their own risk.
No representation, warranty, or undertaking, express or limited, is given as to the accuracy or completeness of the information or opinions contained within this update by Spreadex Ltd or any of its employees and no liability is accepted by such persons for the accuracy or completeness of any such information or opinions. As such, no reliance may be placed for any purpose on the information and opinions contained within this update.
The information contained within this update is the intellectual property of Spreadex Ltd and is protected by UK and International copyright laws. All rights reserved. Users may however freely download, distribute and reproduce extracts of the contents, subject always to accrediting Spreadex Ltd as the source and providing a hyperlink to www.spreadex.com.


